


If one were to select a nurse in the United States randomly, that nurse would have the highest chances of possessing the following characteristics:
- Female
- White/Caucasian
- About 50 years old
- BSN RN
That said, this hypothetical nurse is certainly not representative of the entire nursing workforce, which comprises professionals of different ages, genders, races, and levels of education. In turn, these demographic categories experience varying degrees of representation across specialties and locations.
Furthermore, nursing demographics are becoming increasingly diverse, with the percentages of Black/African American and Hispanic nursing students significantly surpassing those of currently licensed nurses, alongside a growing share of male nurses.
This report takes a deep dive into nursing demographics, identifying current patterns in age, race, gender, and education as well as trends over time.
About the data
Nursing statistics vary from one survey or report to the next, usually for methodological reasons. Surveys count different populations (license-holders vs. nurses actually working), are fielded in different years, and code race and gender differently. All are sample surveys, so each percentage has a margin of error, and figures may not sum to 100% due to rounding or omitted categories.
Two national surveys anchor this report.
- The National Council of State Boards of Nursing (NCSBN) 2024 National Nursing Workforce Survey (published in the Journal of Nursing Regulation in April 2025) covers everyone who holds a license, including nurses who aren't working.
- The Health Resources and Services Administration (HRSA) National Sample Survey of Registered Nurses (NSSRN), last fielded in 2022, covers RNs currently employed in nursing and is the only national source that publishes demographics by state and rurality.
Each survey codes race differently: NCSBN asks race and Hispanic origin as separate questions, so its "White" figure includes Hispanic White nurses, while NSSRN reports non-Hispanic categories.
Student figures come from the National League for Nursing's 2023 survey, and population benchmarks come from the U.S. Census Bureau QuickFacts (Vintage 2025). The source is named for every major figure, and the newest national data has been given preference over older data.
Overall snapshot: Who are U.S. nurses?
At the start of 2024, there were 5,641,311 active RN licenses and 968,948 active LPN/LVN licenses in the United States (NCSBN 2024). Licenses outnumber nurses because a nurse practicing across state lines may hold more than 1 license, and only about 88% of license holders are working in nursing.
Table 1
Source: NCSBN 2024 National Nursing Workforce Survey (Tables 5, 8, 9, 14, 54, 57, 58, 63)
Most RNs were educated domestically—93.2% completed entry-level nursing education in the United States, with the Philippines the largest single foreign source at 3.6% (NCSBN 2024, Table 21).
Age demographic statistics
(Data drawn from the NCSBN 2024 National Nursing Workforce Survey and HRSA's 2022 NSSRN)
The median age of both RNs and LPNs/LVNs is 50 (NCSBN 2024). That figure describes license holders, though, and license holders are older than the people actually at the bedside: among RNs employed in nursing, the median age is 45.6, and the average age is 46.5 (NSSRN 2022).
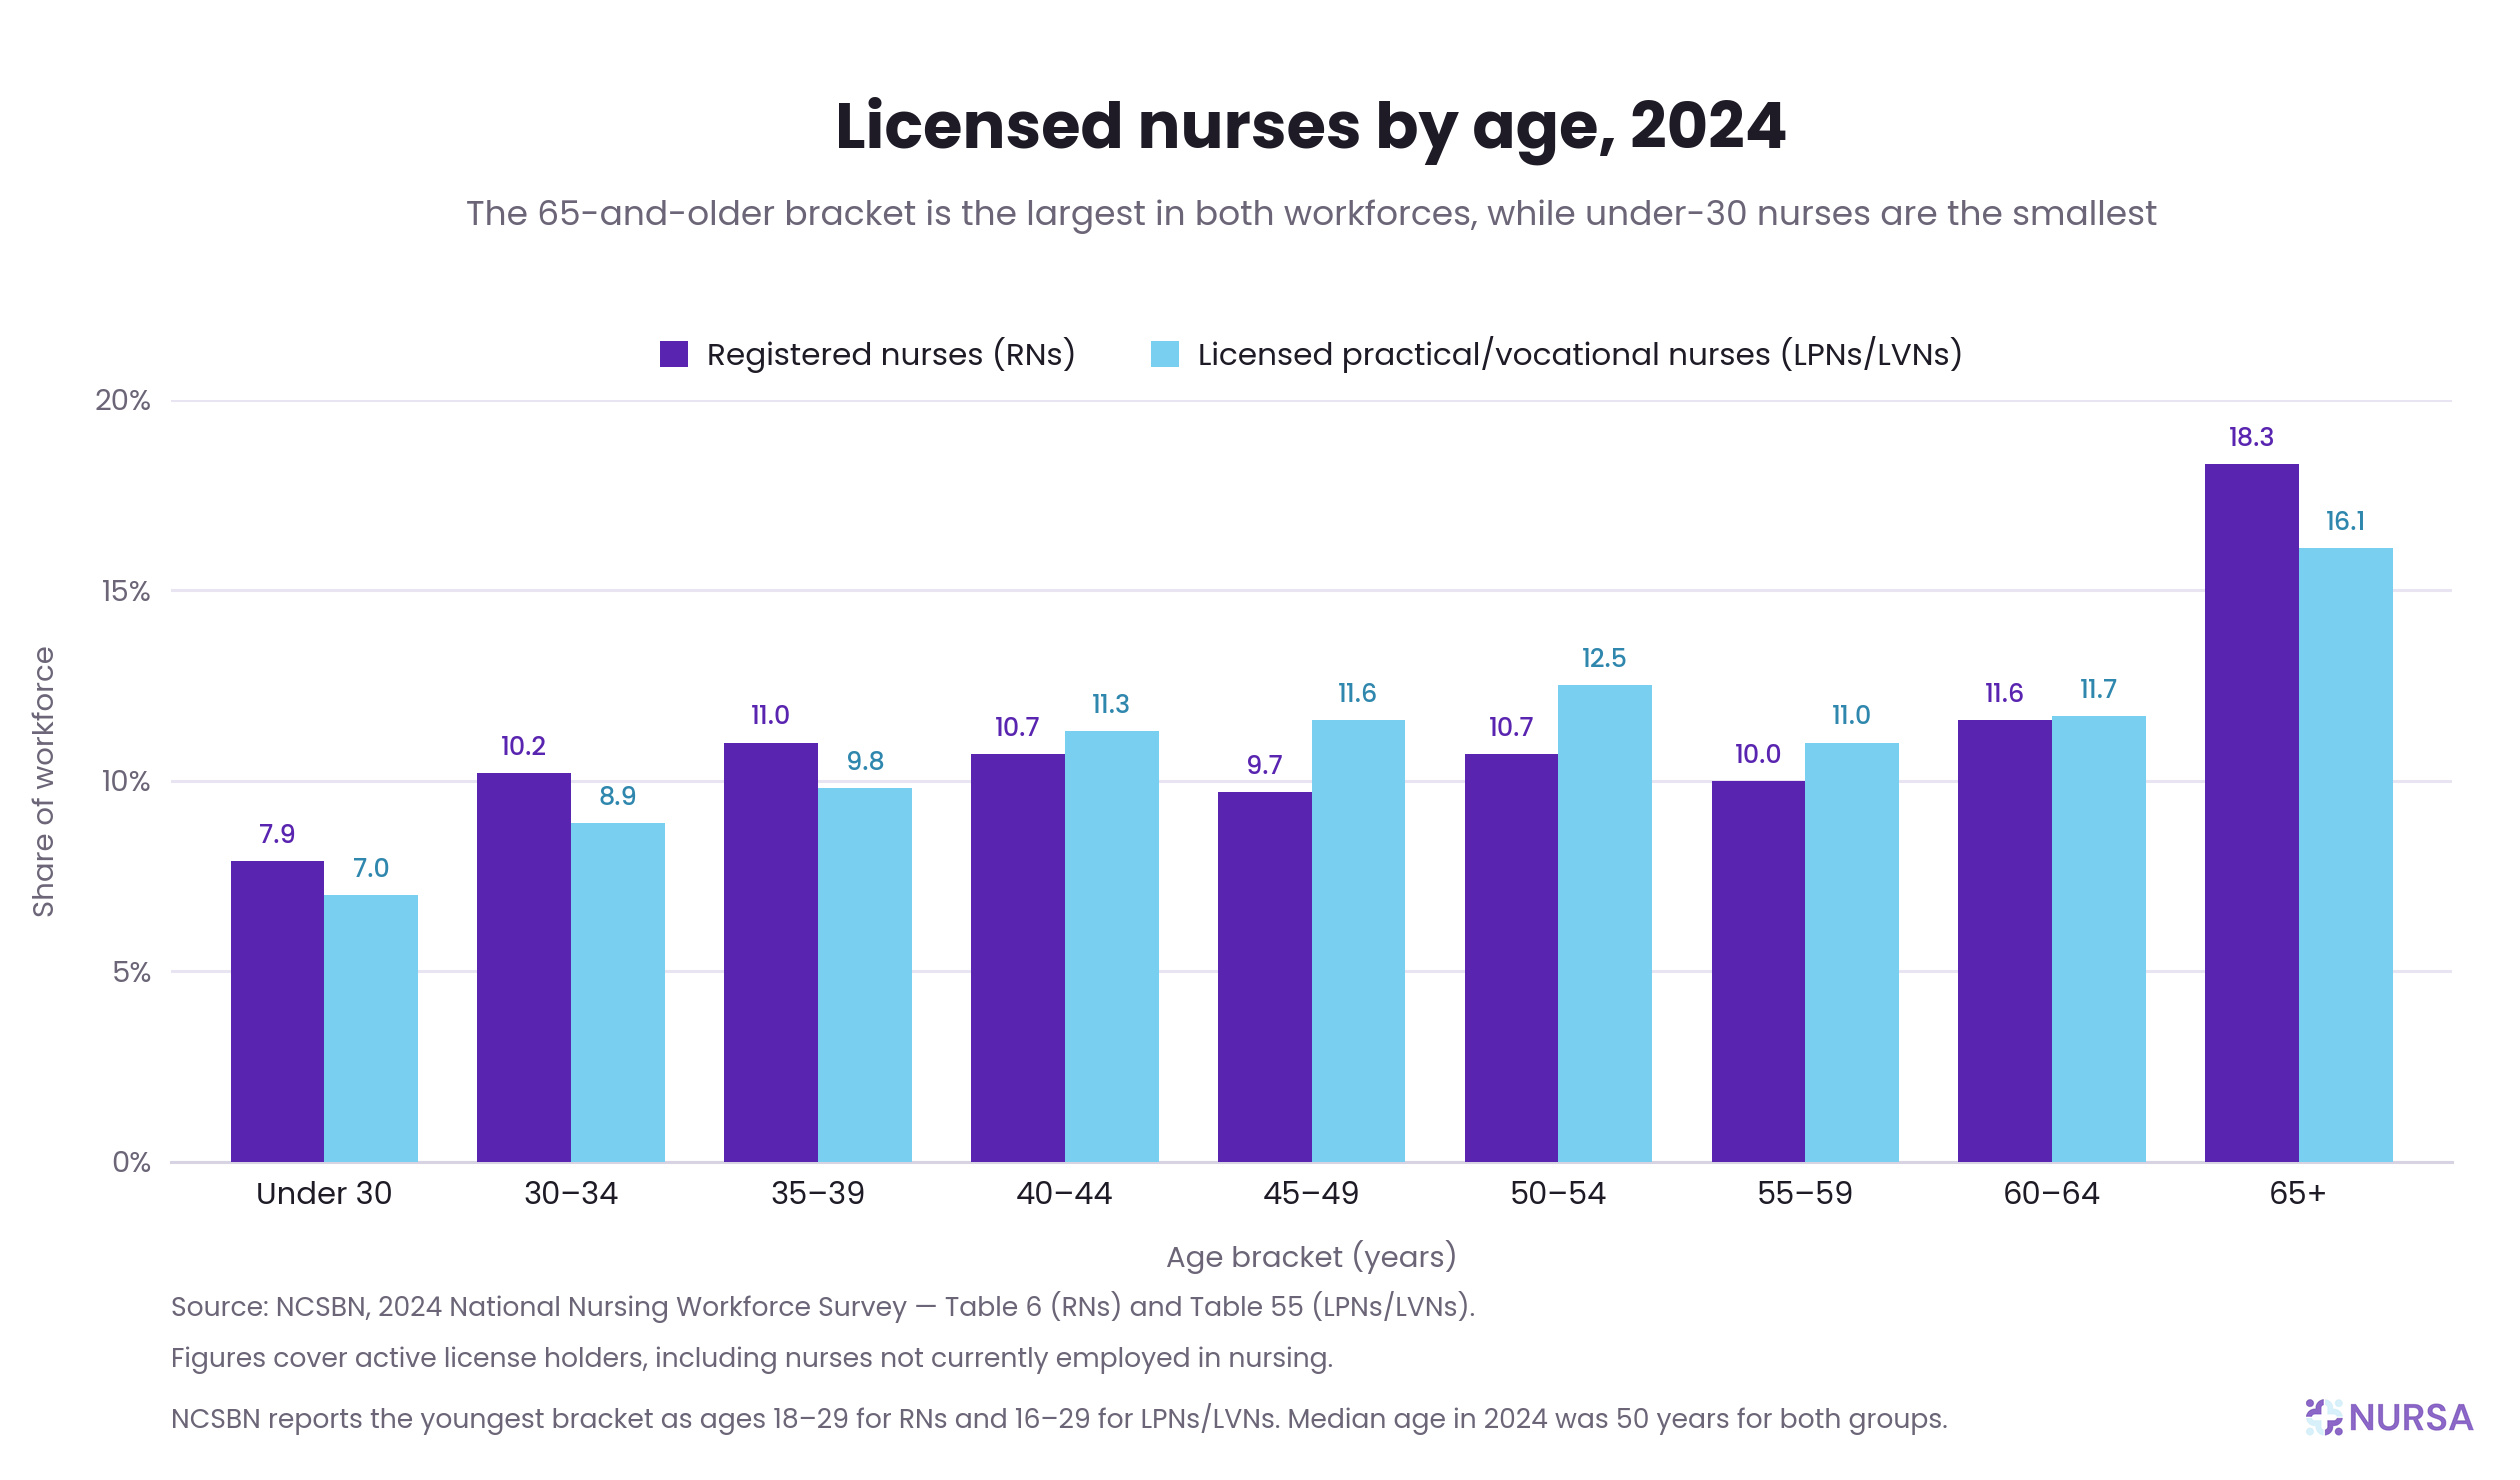
For RNs, the distribution is bottom-light and top-heavy. The single largest bracket is 65 and older at 18.3%, and the smallest is under 30 at 7.9%. Between those ends, the curve is nearly flat—every bracket from 30 to 64 sits between 9.7% and 11.6%.
LPNs/LVNs are older than RNs in the middle rather than at the top. Their 40–54 brackets carry more weight than the RN equivalents, peaking at 12.5% for ages 50–54, and their 65-and-older share is smaller at 16.1%. Their entry pipeline is thinner than that of RNs: 7% of LPNs/LVNs are under 30, below the previous low of 7.4% in 2020.
What the 2 licenses share is the balance point. Slightly more than half of each workforce is 50 or older, while nurses under 35 account for just 18% of RNs and 16% of LPNs/LVNs (NCSBN 2024). Whichever license you look at, roughly 3 nurses are within 15 years of retirement age for every 1 who has entered in the last decade.
How the age distribution has changed
The current picture is a rebound, not a steady state. Median age rose from 46 to 50 for RNs and from 47 to 50 for LPNs/LVNs between the 2022 and 2024 surveys (NCSBN). The share aged 50 or older tells the same story more sharply: it fell to approximately 43% of RNs and nearly 45% of LPNs/LVNs in 2022, then climbed back above half for both in 2024.
For RNs, the longer series shows the full swing. Nurses 55 or older were 42.5% of licensed RNs in 2020, fell to 31.2% in 2022, and returned to 39.9% in 2024. NCSBN attributes the dip to older nurses who left or hastened retirement during the pandemic, and the recovery to some of them returning.
The concerning movement is at the other end, and it has not rebounded. RNs under 30 fell from 11.1% in 2022 to 7.9% in 2024. A workforce that is simultaneously growing at the top and thinning at the bottom has a succession problem.
Retirement intent confirms the pressure. There is no standard nurse retirement age, but intentions are measurable: among employed RNs, 20% are already retired or plan to retire within 5 years (NSSRN 2022), and another 18% are undecided.
Gender demographic statistics
(Data drawn from the NCSBN 2024 National Nursing Workforce Survey)
The gender distribution in nursing remains heavily skewed. RNs are 89.3% female, 10.4% male, and 0.4% nonbinary, and LPNs/LVNs are similar at 90.8% female, 9.1% male, and 0.2% nonbinary.
Note: NCSBN added a third gender option in 2020 and renamed it "nonbinary" in 2022, so trend data on nonbinary nurses remains limited.
Are more men entering nursing?
The long trend for men in nursing is up—male nurses were 8% of RNs in 2015 and 11.2% in 2022—but the 2024 figure of 10.4% ticked down. The clearer picture is where each group sits on the age curve:
Table 2
Source: NCSBN 2024, Table 7
Male nurses peak near the middle of the curve—14.2% are 35–39—while female nurses peak at the top, with 19.2% aged 65 or older. NCSBN reads it the same way: male nurses tend toward the middle-aged groups, the largest cohort of female nurses is the oldest, and nonbinary nurses skew younger, their number peaking at 22.7% in the 30-34 age group.
That difference has an arithmetic consequence. Because a larger share of women than men sits in the oldest bracket, retirements remove proportionally more women, nudging the male share upward even with no change in recruitment.
How do gender demographics differ by specialty?
Men cluster in high-acuity, procedure-heavy roles.
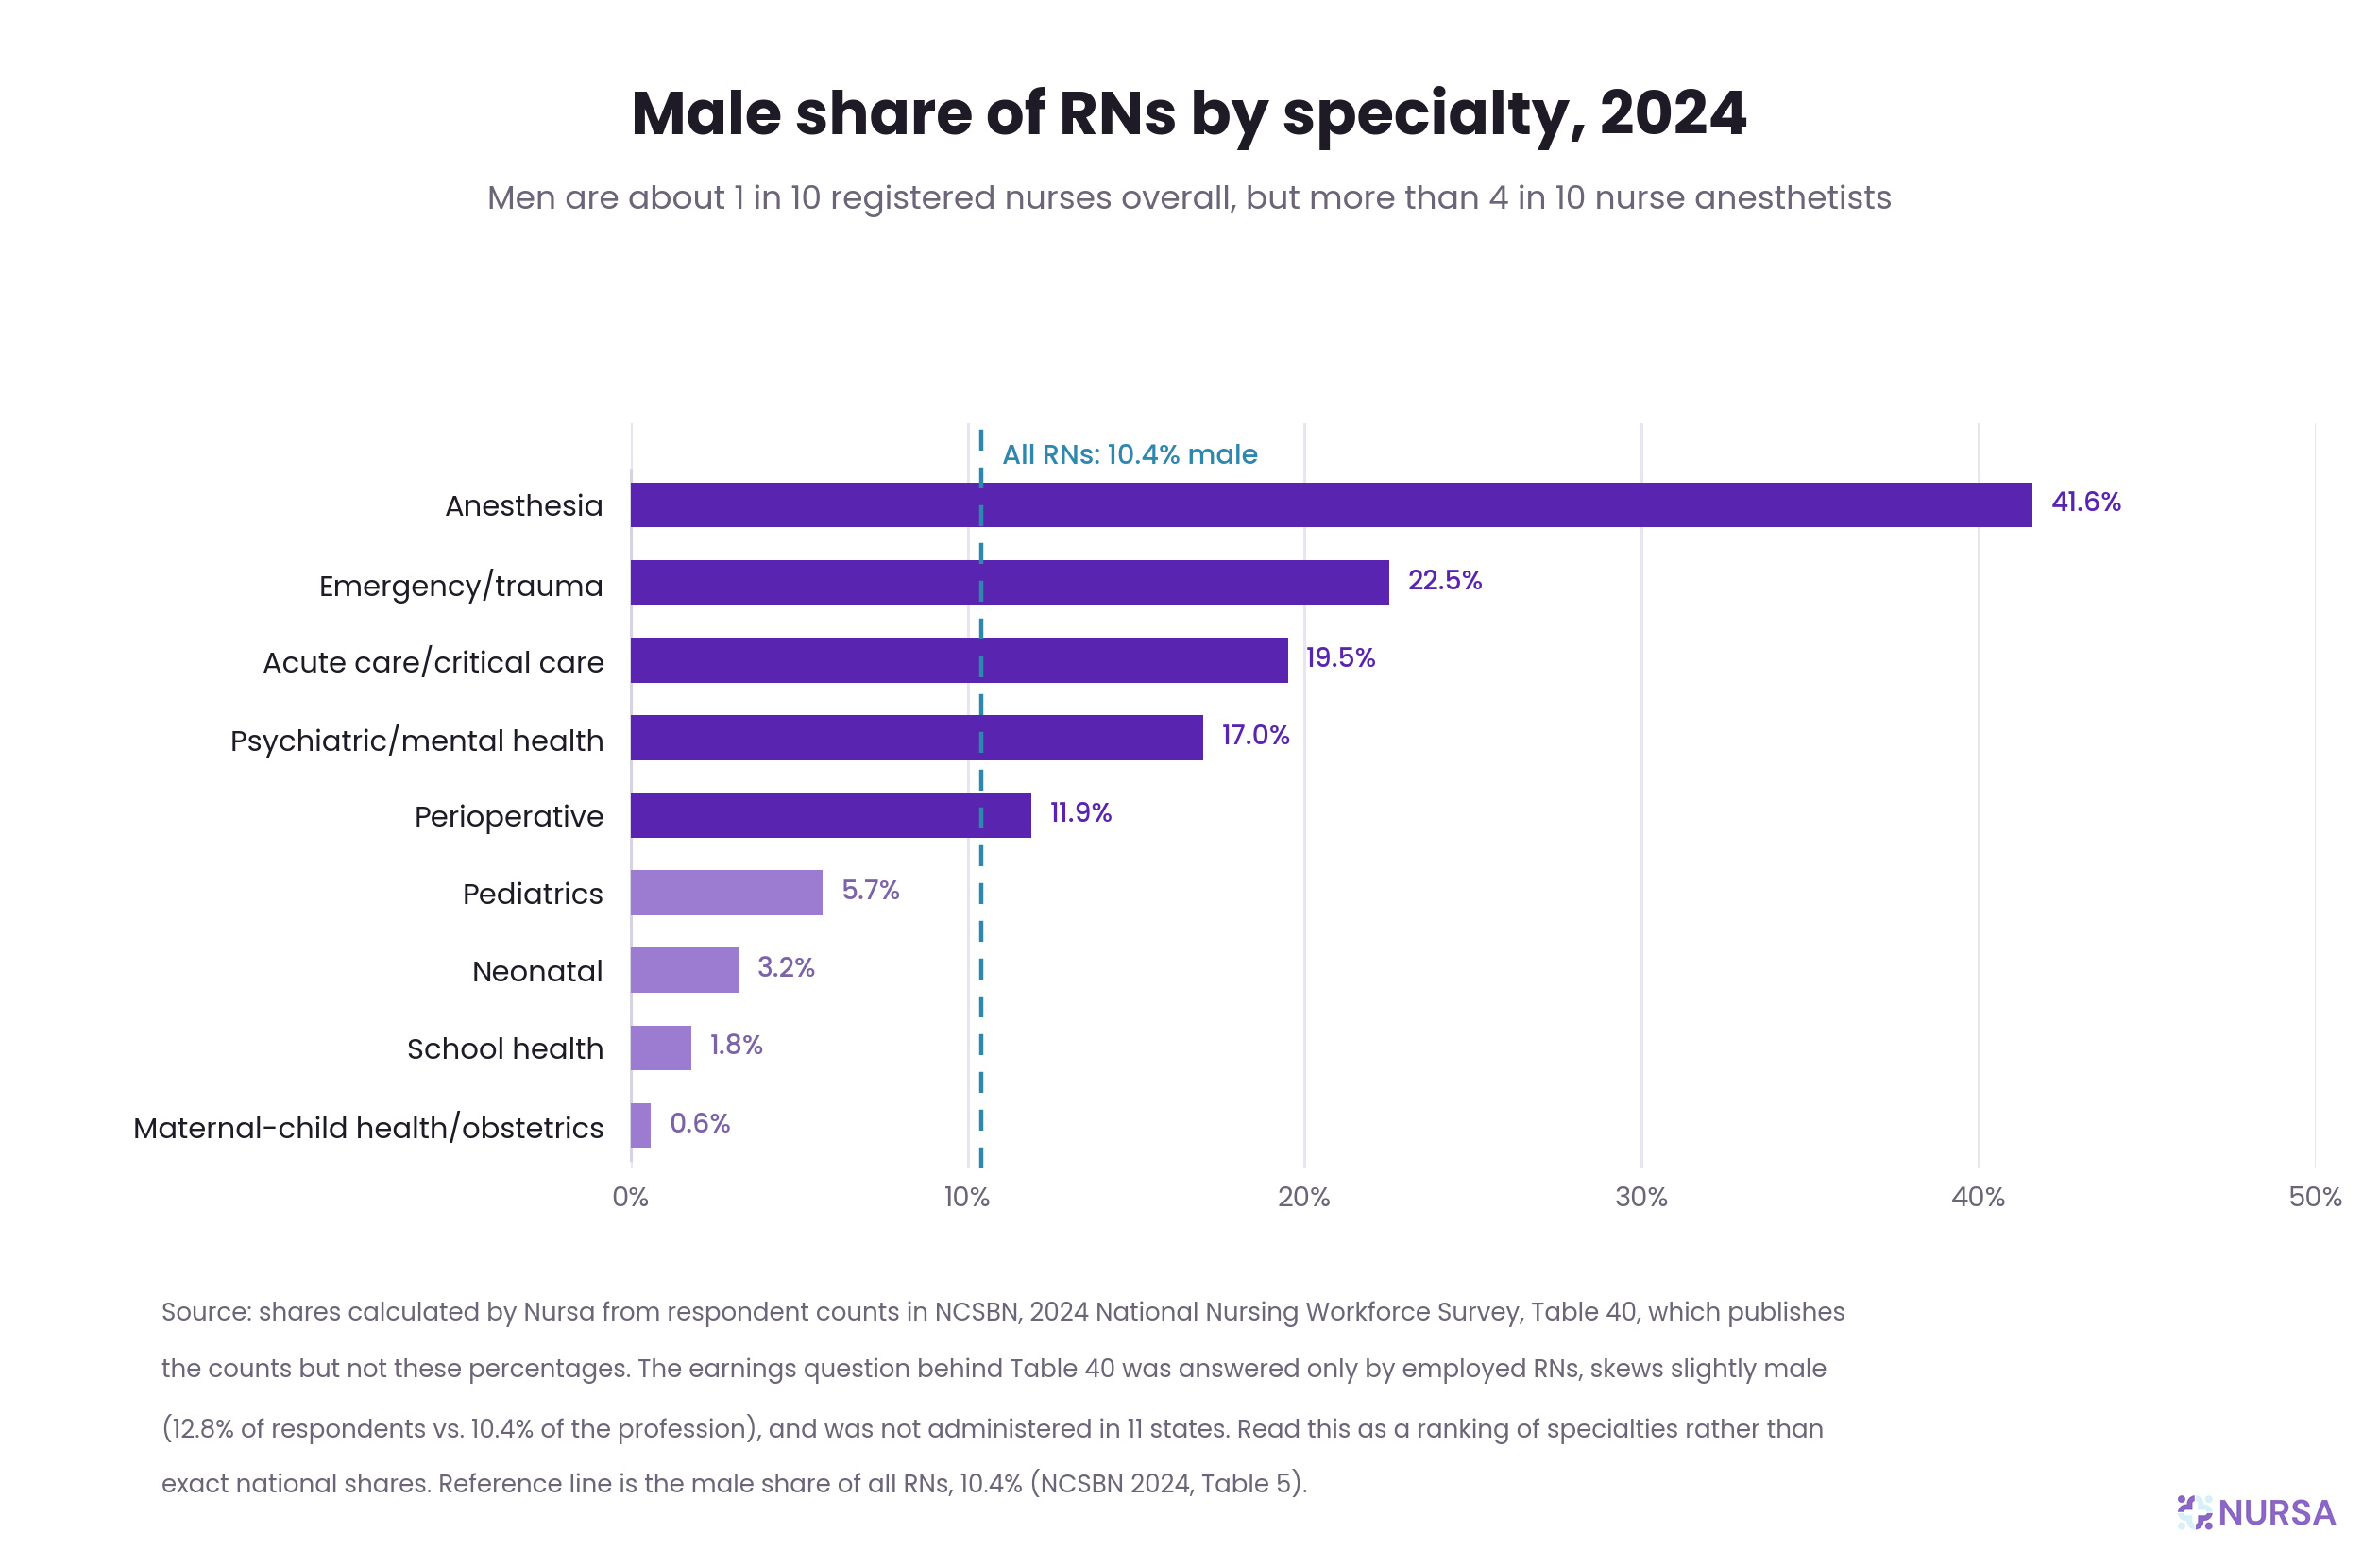
Nurse anesthesia is the standout: men are about 1 in 10 nurses overall, but more than 4 in 10 certified registered nurse anesthetists (CRNAs)—the highest-paid role in nursing. Data USA's 2024 estimate independently puts the CRNA workforce at 41.9% men, corroborating this report's estimate.
How does gender affect nursing roles and pay?
Female RNs report a median of $86,000 against $95,000 for men—about 90 cents on the dollar (NCSBN 2024, Table 40). Specialty mix explains part of that, but the gap persists inside specialties: in emergency/trauma, women earn 90% of men's median, in acute care 93%, in perioperative 89%. In anesthesia, the gender pay gap is even more pronounced, with women CRNAs earning just 81% of men’s median income ($200,000 vs $247,000).
Leadership shows distinct gender trends as well.
According to a cross-sectional study, Representation of Women in Top Executive Positions in General Medical-Surgical Hospitals, data sourced from the American Hospital Association of 4,397 hospitals in 2017 (the most recent national count available), shows the following:
Women hold 91% of chief nursing officer (CNO) roles but only 27% of hospital chief executive officer (CEO) roles and 13% of system CEO roles.
In short, women run nursing; men still run hospitals.
Gender diversity is arriving by generational replacement rather than by a surge in recruitment, and men remain concentrated where the money is.
Are there gender differences in nurse burnout?
No national nursing survey measures burnout by gender, so there's no representative figure.
The closest evidence is a 2023 survey of 210 U.S. nurse leaders using the Copenhagen Burnout Inventory (Alenezi et al., BMJ Open, 2024). Women scored higher on personal burnout—exhaustion rooted in life outside work—at 56.2 versus 49.3, while men scored higher on client-related burnout, at 45.3 versus 34.8. Work-related burnout showed no significant difference. The authors read this as men and women experiencing burnout differently rather than unequally.
A 2024 review of 71 studies of women in healthcare occupations across 26 countries found that women report significantly higher stress and burnout than their male counterparts, with work-life integration among the recurring drivers (Karakcheyeva et al., Global Advances in Integrative Medicine and Health).
Read those data points as directional: the first one is a convenience sample of nurse leaders rather than bedside nurses, and the other covers women in healthcare, so it includes non-nursing professions such as physicians and social workers.
For burnout rates by state, see our breakdown of states with the most burnout among nurses.
Race and ethnicity demographic statistics
(Data drawn from the NCSBN 2024 National Nursing Workforce Survey and U.S. Census Bureau QuickFacts, Vintage 2025)
Diversity is uneven across licensure levels. Nurses of color are far better represented among LPNs/LVNs than among RNs.
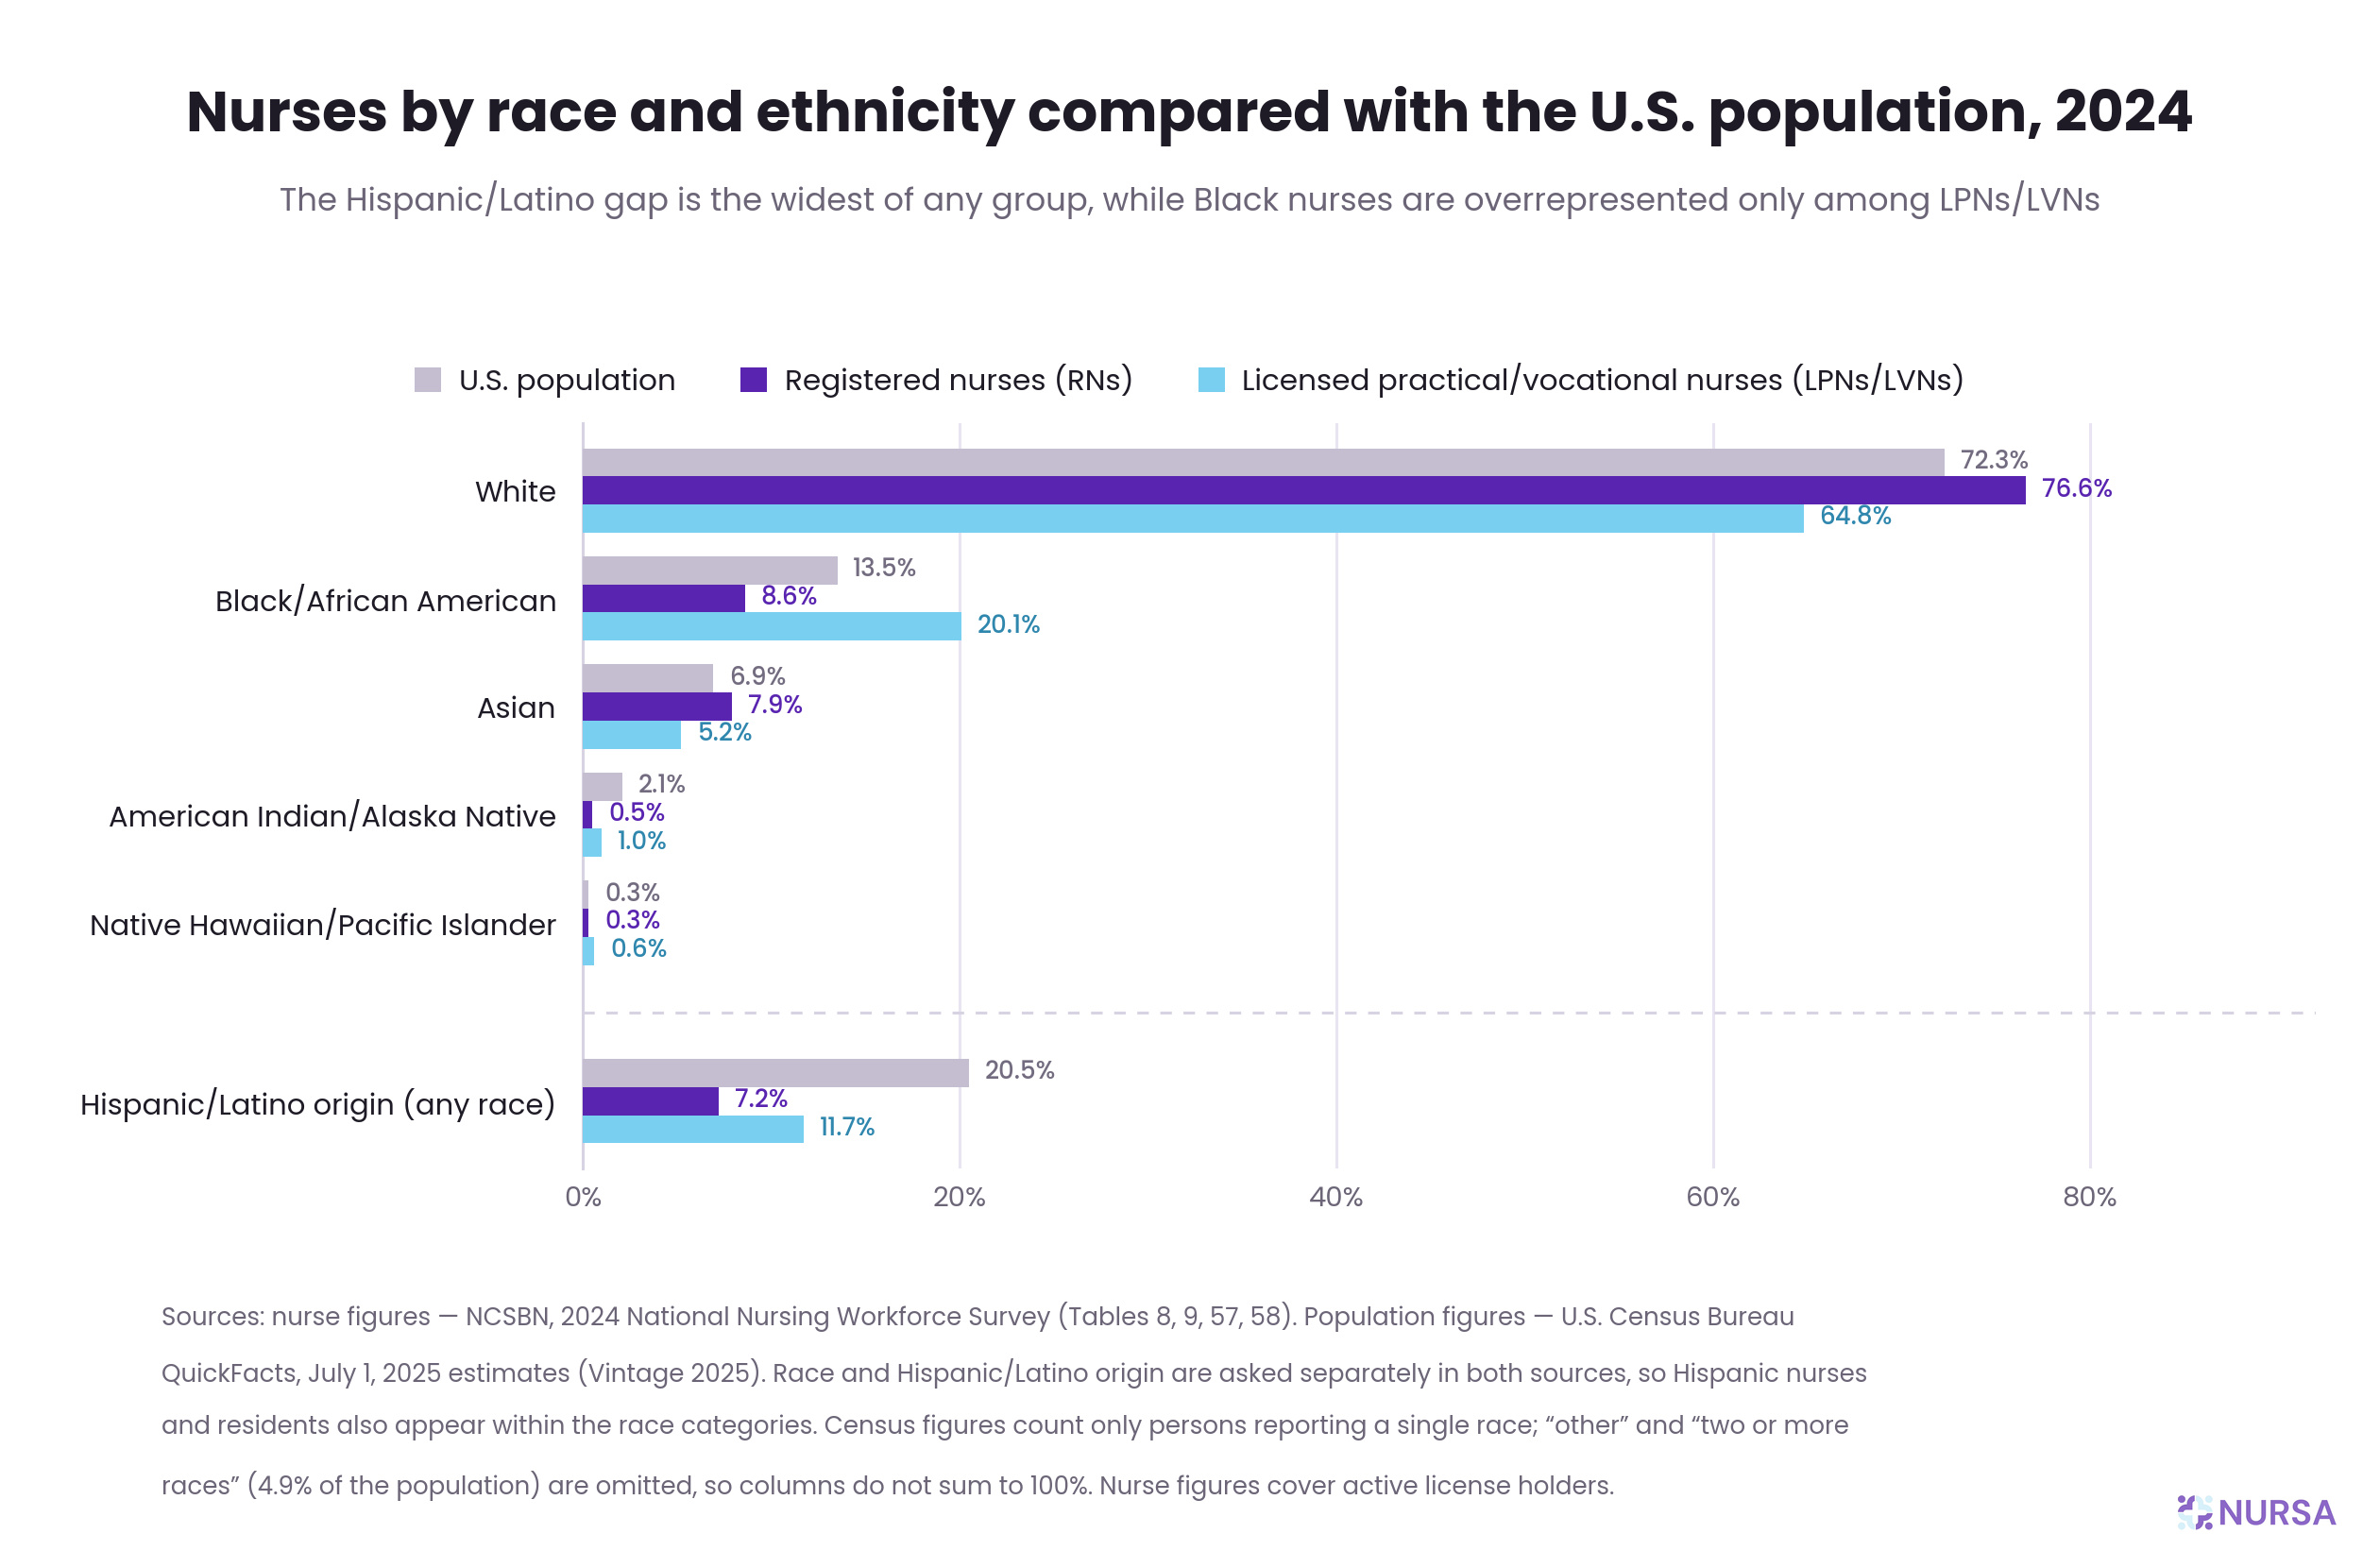
The Hispanic/Latino gap is the widest of any group: about 1 in 5 Americans is Hispanic, but only about 1 in 14 RNs. Black nurses are underrepresented among RNs yet substantially overrepresented among LPNs/LVNs—a pattern that makes LPN-to-RN bridge programs one of the most direct levers available for diversifying the RN workforce.
Nursing ethnic diversity is improving, if slowly.
Between 2022 and 2024, the White share of RNs fell from 80% to 76.6% while the Black share rose from 6.3% to 8.6% (NCSBN). HRSA's employed-RN data shows the same movement over a longer window: non-Hispanic White RNs fell from 72% in 2018 to 65% in 2022, with Black RNs rising from 8% to 11% and Asian RNs from 5% to 9%.
Diversity is also generational. Among RNs aged 65 and older, 87.6% are White; across the 30–54 age bands, that figure ranges from 67% to 73.4% (NCSBN 2024, Table 11).
Race and the nursing experience
Representation numbers don't capture what working in nursing feels like.
In a voluntary national survey of 5,623 nurses conducted by the National Commission to Address Racism in Nursing in October 2021, 63% of respondents reported personally experiencing racism in the workplace:
- 92% of Black nurses
- 73% of Asian nurses
- 69% of Hispanic nurses
- 28% of White nurses
Three out of 4 nurses have witnessed racism at work, and among those who challenged it, 64% said their efforts produced no change.
Retirement plans differ by group as well.
Among employed RNs, 23% of White nurses are retired or plan to retire within 5 years, against 19% of Black, 18% of Asian, and 15% of Hispanic nurses. White RNs also skew the oldest, which likely accounts for part of the difference, though that comparison draws on a different survey (NCSBN 2024, Table 11). The more striking number is uncertainty: 31% of Black RNs and 29% of Asian RNs say they are undecided about retirement, against 14% of White RNs (NSSRN 2022).
Nurse education levels by demographic group
(Data drawn from the NCSBN 2024 National Nursing Workforce Survey)
A Bachelor of Science in Nursing (BSN) is now the most common highest credential among RNs at 47.8%, with 20.6% holding a master's and 4.5% a doctorate, including Doctor of Philosophy (PhD), Doctor of Nursing Practice (DNP), and other nursing doctoral degrees.
Black RNs hold graduate degrees at a higher rate than any other large racial or ethnic group—29.9%, compared with 25.5% of White RNs, 23.4% of Hispanic RNs, and 19.1% of Asian RNs (NCSBN 2024, Table 16). Native Hawaiian and Pacific Islander RNs report a slightly higher rate still, at 30.5%, but on a sample size too small to lean on. Asian RNs hold BSNs at the highest rate of any group, at 65.3%.
By gender, educational attainment is nearly identical: 26.1% of male RNs and 25% of female RNs hold a graduate degree.
Entry pathways have narrowed. Between 2015 and 2024, the share of RNs whose highest credential is a diploma fell from 9.2% to 4.3%, and the associate-degree share fell from 30.1% to 22.8% (NCSBN 2024, Table 14).
For enrollment and program-level data, see our nursing school statistics report.
Nurse demographics by state and rurality
(Data drawn from HRSA's 2022 National Sample Survey of Registered Nurses)
National averages hide enormous variation in who nurses are, state to state.
Table 3
Source: NSSRN 2022, employed RNs
Nurse populations in rural areas
About 11.1% of employed RNs work in rural areas, against 80.3% in non-rural areas, with rurality unclassified for the remaining 8.5% (NSSRN 2022, RUCA definition). The rural workforce is a demographically different workforce:
Table 4
Additionally, the age gap is modest here—28.6% of rural RNs are 55 or older against 27.3% of non-rural RNs—though HRSA's published subanalysis of the same survey, summarized in the NCSBN 2025 Environmental Scan, describes rural RNs as significantly older as well as less diverse and less credentialed. The diversity and education gaps are unambiguous in both.
The earnings gap is about 12.6%, compounding other rural recruitment challenges.
Nurse migration patterns
Nurses move. About 1 in 4 RNs works in a different state from the one where they completed their initial nursing education—24.6% in non-rural and 22.4% in rural areas (NSSRN 2022).
Rural employers lean somewhat harder on locally educated nurses—75.7% were educated in-state, against 68.4% of non-rural RNs—and far less on internationally educated ones (2% in rural vs. 7% in non-rural areas). That makes in-state training pipelines disproportionately important for rural staffing.
Geographic composition, not just headcount, determines whether a workforce reflects its patients, and flexible models are among the few tools that extend coverage without requiring relocation. HRSA's telehealth subanalysis found that telehealth was more likely to be delivered by female RNs, rural RNs, and RNs of color (NCSBN 2025 Environmental Scan).
Who's in the pipeline?
(Data drawn from the NCSBN 2025 Environmental Scan, reporting National League for Nursing 2023 survey data)
Tomorrow's workforce is already more diverse than today's. The following breakdown was observed among prelicensure RN students in 2023:
- African American: 14.2%
- Hispanic: 13.8%
- Asian or Pacific Islander: 9.5%
The current RN workforce is 8.6% Black and 7.2% Hispanic—based on different surveys, so treat the comparison as directional.
Students are also more gender-diverse: 14.2% male, against 10.4% of practicing RNs.
Nursing faculty are less diverse than students: 74.6% White (compared to 57.6% of students) and 91.6% female (compared to 85.2% of students). In 2023, nursing faculty were 11% African American, 4.8% Asian or Pacific Islander, and 4.6% Hispanic.
Nursing demographics frequently asked questions
How many nurses are in the U.S.?
There were 5,641,311 active RN licenses and 968,948 active LPN/LVN licenses at the start of 2024 (NCSBN). Licenses exceed the number of nurses, since many hold licenses in more than one state.
What is the average age of nurses in the U.S.?
The median is 50 for both RNs and LPNs/LVNs (NCSBN 2024); among employed RNs, the average age is 46.5 (NSSRN 2022). About 40% of RNs are 55 or older.
What percentage of nurses are women vs. men?
RNs are 89.3% female, 10.4% male, and 0.4% nonbinary. LPNs/LVNs are 90.8% female, 9.1% male, and 0.2% nonbinary (NCSBN 2024).
What percentage of nurses have a BSN or higher?
Approximately 73% of RNs have a BSN or higher degree, up from nearly 61% in 2015. Among LPNs/LVNs, 2.5% hold a baccalaureate.
Which racial or ethnic groups are underrepresented in nursing?
Hispanic/Latino nurses show the widest gap—7.2% of RNs versus 20.5% of the U.S. population. Black nurses are underrepresented among RNs (8.6% vs. 13.5%) but overrepresented among LPNs/LVNs (20.1%). American Indian/Alaska Native nurses are underrepresented at both levels.
How do demographics differ by nursing specialty and setting?
Demographics vary on both counts. For instance, men make up approximately 42% of nurse anesthetists but only 0.6% of maternal-child health nurses. Rural nurses are 86.3% White, compared with 62.6% of non-rural nurses.
What nursing demographic statistics mean for you
The impact of these nursing demographic statistics varies based on the reader and their role in the field.
- A Hispanic nurse may feel inspired to know that the next cohort of nurses nearly doubles the current Hispanic representation among RNs.
- A man daunted by the idea of entering a female-dominated field may feel encouraged by the fact that the trend of men in nursing is increasing and that in specialties like anesthesia and emergency care, men are already a substantial minority.
- A nurse executive may decide to prioritize retention and recruitment efforts when confronted with the high percentage of nurses who plan to retire within the next 5 years.
- At the federal, state, or facility level, Black/African American LPNs/LVNs could be incentivized to complete LPN-to-RN bridge programs, thereby increasing the representation of Black/African American RNs.
For more information on nursing shortages, nurse density by state, common settings, and work schedules, see our report on nursing workforce statistics.
Sources:
- The 2024 National Nursing Workforce Survey
- The 2025 NCSBN Environmental Scan: Going Beyond
- The 2022 National Nursing Workforce Survey
- NCHWA Nursing Workforce Dashboard
- 2022 National Sample Survey of Registered Nurses Snapshot
- Racism's Impact in Nursing
- Representation of Women in Top Executive Positions in General Medical-Surgical Hospitals in the United States
- Data USA: Nurse Anesthetists
- U.S. Census Bureau: QuickFacts: United States
- The Well-Being of Women in Healthcare Professions: A Comprehensive Review
- Gender differences in burnout among US nurse leaders during COVID-19 pandemic: an online cross-sectional survey study

