


Certified nursing assistants (CNAs) are the largest hands-on care workforce in American nursing homes and a core part of hospital bedside teams. Yet their numbers, pay, and working conditions are tracked in pieces across several federal datasets. This report pulls those statistics together.
The picture that emerges is one of tension. Across industries, CNA employment has grown over the last decade, but nursing-home CNA employment is below its 2015 level. CNA pay still trails comparable jobs, and demand for CNA hours in long-term care is projected to rise sharply over the next decade. For context on the broader nursing workforce, see Nursa's U.S. nursing statistics report.
Key findings
- The CNA labor market is defined by churn, not growth. Nursing assistant jobs grew just 2% in the past decade and are projected to grow 3% in the next one, yet the BLS expects about 203,300 openings a year, roughly 50 positions refilled for every new one created.
- Nursing homes are losing the occupation, not just headcount. Nursing-home CNA jobs fell 13% from 2015 to 2025 while the occupation grew, cutting nursing homes' share of all CNA jobs from 43% to 37%. Meanwhile, HRSA projects long-term care demand for CNAs to rise 35% by 2038, so the gap between the care nursing homes will need and the aides they employ is set to widen.
- The pay problem is relative, not absolute. No state pays CNAs at or above its all-occupation median wage; in the median state, CNAs earn 80% of it. High-wage states such as Massachusetts and Maryland rank among the worst because their overall labor markets pay so much more.
- A CNA's nearest exits pay more. Ten of 13 jobs with comparable entry requirements out-pay the $20.32 CNA median, including every healthcare alternative, from dental assistant to emergency medical technician (EMT), by $1 to $3 an hour.
- Wages retain CNAs, specifically. Each $1 increase in CNA hourly pay is associated with a 0.35 percentage-point drop in CNA turnover, with no comparable effect for RNs or LPNs/LVNs, so a dollar of wage budget retains more staff when it goes to aides. Nearly half of all nursing staff in nursing homes turn over each year.
- Hours drive income as much as rates do. More than a third (35%) of nursing-home CNAs do not work full-time year-round (27% work part-time, and 17% work part-year, with some overlap), so nursing-home CNAs’ actual median income is about $10,500 below the full-time-equivalent wage. Schedule and shift access are retention levers that cost nothing in hourly rate terms.
- Injury is a retention issue. Nursing assistants are injured at nearly 4 times the all-occupation rate, and a typical injury costs 10 days of work. The gap is widest for violent acts, at about 8 times the all-occupation rate.
- The federal staffing floor is gone, and many facilities were below it anyway. Only about a third of nursing homes report nurse aide staffing at or above the repealed 2.45 hours per resident day. Adequacy now rests on the sufficient-staff standard and the facility assessment, which makes internal visibility into aide hours the compliance case.
About the data
The federal occupation is "nursing assistant" (Standard Occupational Classification, or SOC, code 31-1131). This report uses "CNA" throughout to describe the occupation as a whole. Figures labeled "Nursa calculations" are derived from these sources.
- Employment and wages: U.S. Bureau of Labor Statistics (BLS) Occupational Employment and Wage Statistics (OEWS), May 2025 and May 2015. OEWS counts jobs rather than people and reports nominal wages.
- Demographics: BLS Current Population Survey (CPS), 2025 annual averages. BLS notes these are 11-month averages because October 2025 data were not collected during the federal shutdown.
- Demand projections: Health Resources and Services Administration (HRSA) Health Workforce Simulation Model (December 2025), which models long-term services and supports (LTSS) demand only, and the BLS Occupational Outlook Handbook, 2025–2035.
- Nursing-home workforce: PHI, Direct Care Workers in the United States: Key Facts 2026, built on OEWS May 2025, the 2024 American Community Survey, and CMS Payroll-Based Journal (PBJ) data for 2025.
- Staffing hours and turnover: CMS Care Compare Provider Information file, September 2026 release.
- Regulation: CMS interim final rule repealing the federal minimum staffing standards (CMS-3442-IFC).
- Research: Dobbs et al. (2025) and Pradhan et al. (2026), The Gerontologist.
How many CNAs are there in the U.S.?
There were 1,448,910 nursing assistant jobs in the United States in May 2025, according to BLS OEWS. The Current Population Survey, which counts employed people rather than jobs, put the figure at 1,404,000 nursing assistants in 2025. The two numbers differ because OEWS is an employer survey that counts every payroll position, so a CNA holding 2 part-time jobs appears twice, while CPS is a household survey that counts each worker once. OEWS also excludes self-employed workers.
For scale, CNAs outnumber LPNs/LVNs by about 2.2 to 1, and there are roughly 0.43 CNAs for every registered nurse. Orderlies and psychiatric aides are separate Standard Occupational Classification (SOC) codes in BLS data and are excluded from the CNA figures in this report.
Visual 1: CNA employment compared with related occupations
Source: BLS OEWS, May 2025, national cross-industry estimates
Where CNAs work
Where CNAs work matters more than the national headcount for anyone setting pay or building a staffing model. Just 2 settings, skilled nursing facilities and hospitals, hold about 70% of all CNA jobs, and they pay differently, staff differently, and are regulated differently.
CNA employment by industry
Visual 2 breaks the 1,448,910 CNA jobs down by industry. Skilled nursing facilities and hospitals together account for 7 in 10; no other setting reaches 12%.
Visual 2: CNA jobs by setting
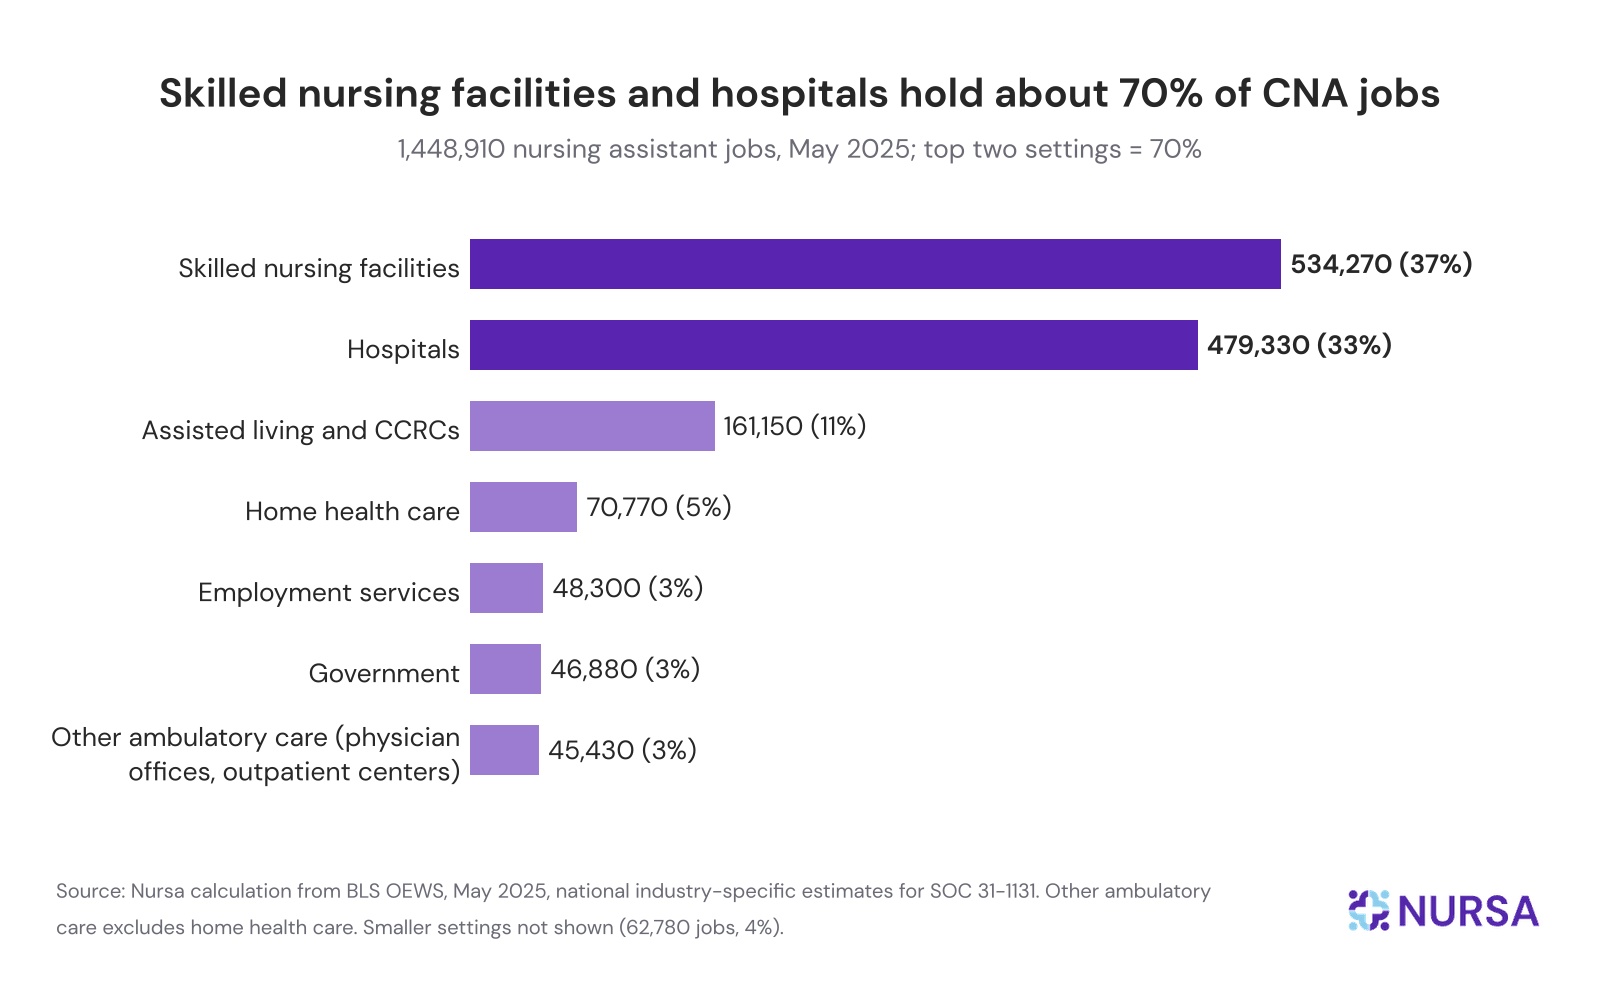
The number of CNAs in home health care may seem surprisingly low, but that’s because most aides in that setting fall under a separate occupation, home health and personal care aides, which doesn’t require CNA certification.
For context, home health care services employed 1,079,060 of those aides in May 2025, about 15 times the number of nursing assistants in the same industry (70,770).
Nursing-home CNA employment: decline and rebound
Across all industries, nursing assistant employment grew by 2% over the past decade: from 1,420,570 jobs in May 2015 to 1,448,910 in May 2025.
Nursing homes went the other way. According to PHI's report, skilled nursing facilities employed 612,120 nursing assistants in 2015 and 534,270 in 2025, a 13% decline. The setting did not just lose CNAs; it lost a share of the occupation, falling from 43% of all nursing assistant jobs to 37%.
Visual 3: CNA employment 2015 vs 2025
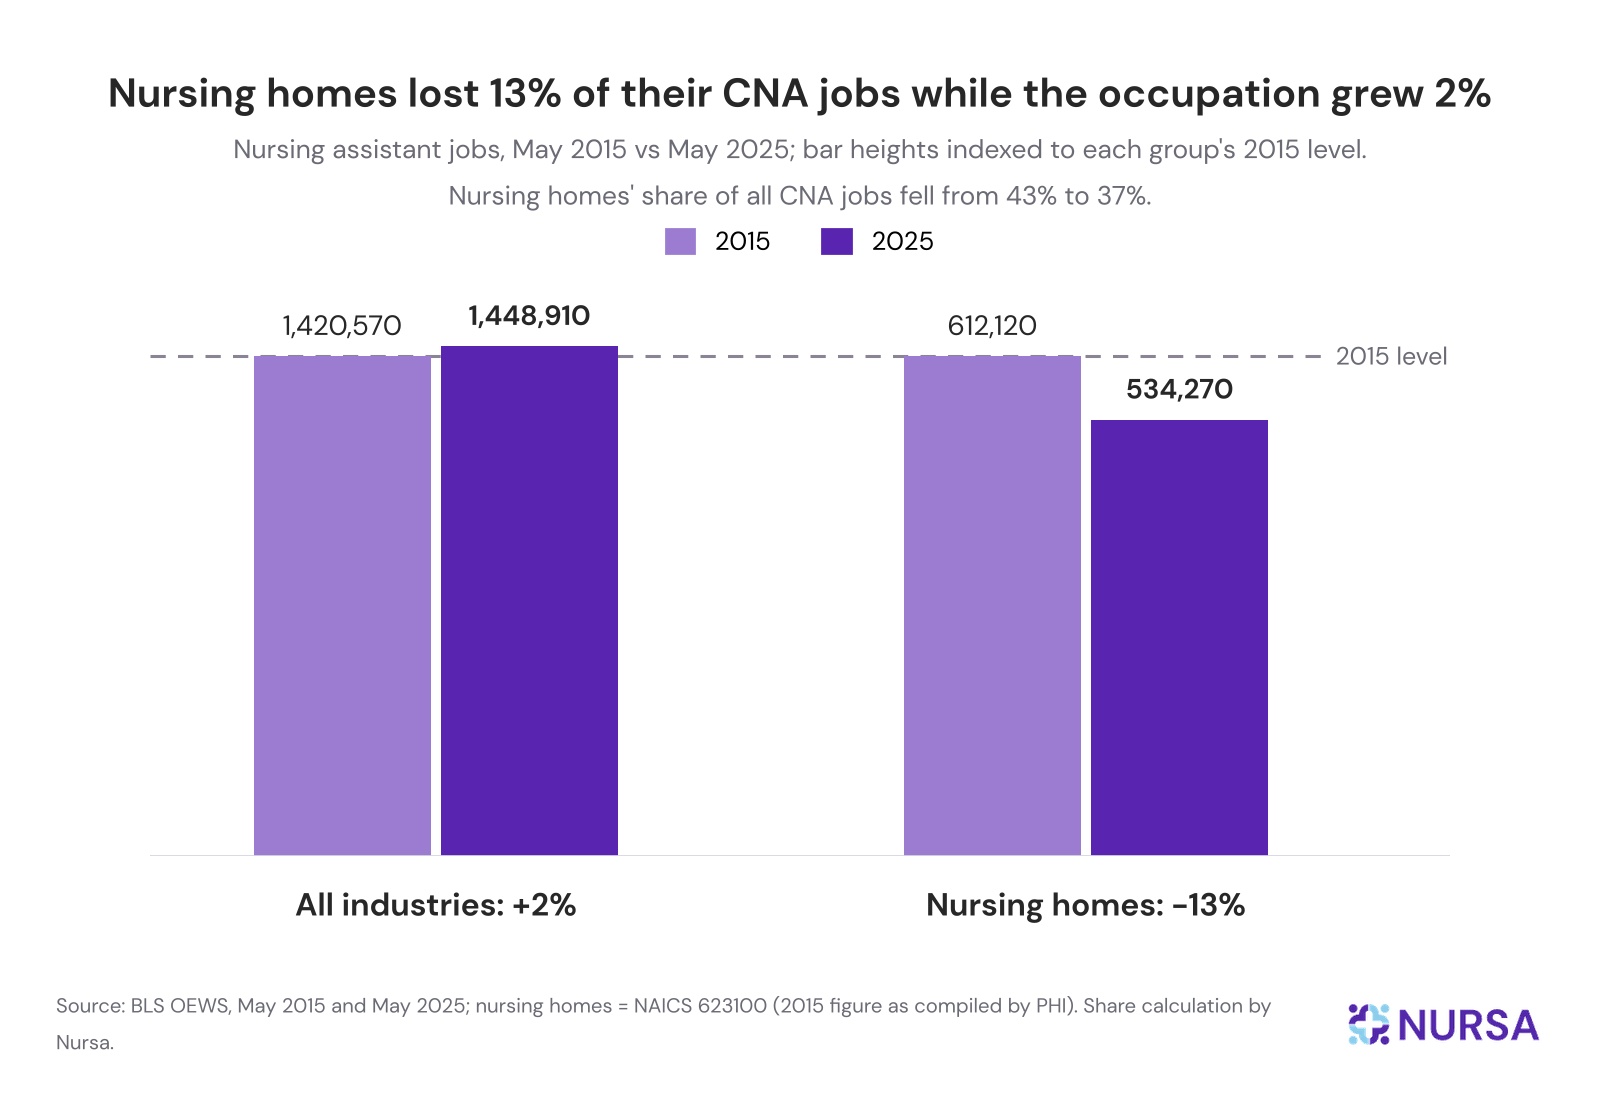
The question for the next decade is whether that decline reverses. HRSA projects demand for nursing assistants in long-term care to rise 35% by 2038 (Visual 11), a rate of growth that nursing homes have not come close to in the past 10 years.
CNA employment and density by state
California, Florida, Texas, New York, and Illinois employ the most CNAs. Those are also among the most populous states, so the ranking mostly reflects size.
To compare how much each state's economy depends on CNAs, Visual 4 uses a different measure: the number of CNA jobs for every 1,000 jobs of any kind in the state. According to the BLS, 9.3 of every 1,000 jobs nationwide are CNA jobs, so a state above that has a workforce weighted toward CNA work, and a state below it does not.
Visual 4: CNA employment density by state, May 2025
Source: BLS OEWS, May 2025, state estimates; territories excluded. National density is a Nursa calculation from the OEWS national table.
For a facility, density describes the recruiting environment.
In a high-density state such as Rhode Island or Kansas, CNAs are a large, established part of the labor force; the pool is deep, but the competition is significant, because the employer down the road is another nursing home or hospital hiring from the same pool.
In a low-density state such as California, Nevada, or Texas, CNAs are a thin slice of a large economy: there is no shortage of workers overall, but there are relatively few trained aides, so facilities depend more on training new entrants and compete for them against every other entry-level employer in the market, a pressure the state pay comparison in Visual 7 makes concrete.
What CNAs earn
The median CNA earned $20.32 per hour, or $42,260 per year, in May 2025. The 10th percentile was $33,940, and the 90th percentile was $51,980, a narrow band that reflects how little room most CNA pay scales leave for progression within the role.
Visual 5 below shows how that compares with related occupations: CNAs earn more than home health and personal care aides but less than medical assistants and phlebotomists, 2 entry-level healthcare roles that recruit from the same pool. CNA pay also varies widely by state. Median hourly pay runs from $23.96 in Oregon to $14.67 in Louisiana, a gap of more than $9 per hour.
Visual 5: CNA pay compared with related occupations
Source: BLS OEWS, May 2025, national cross-industry estimates; sorted by median hourly wage
Pay by work setting and the wage gap
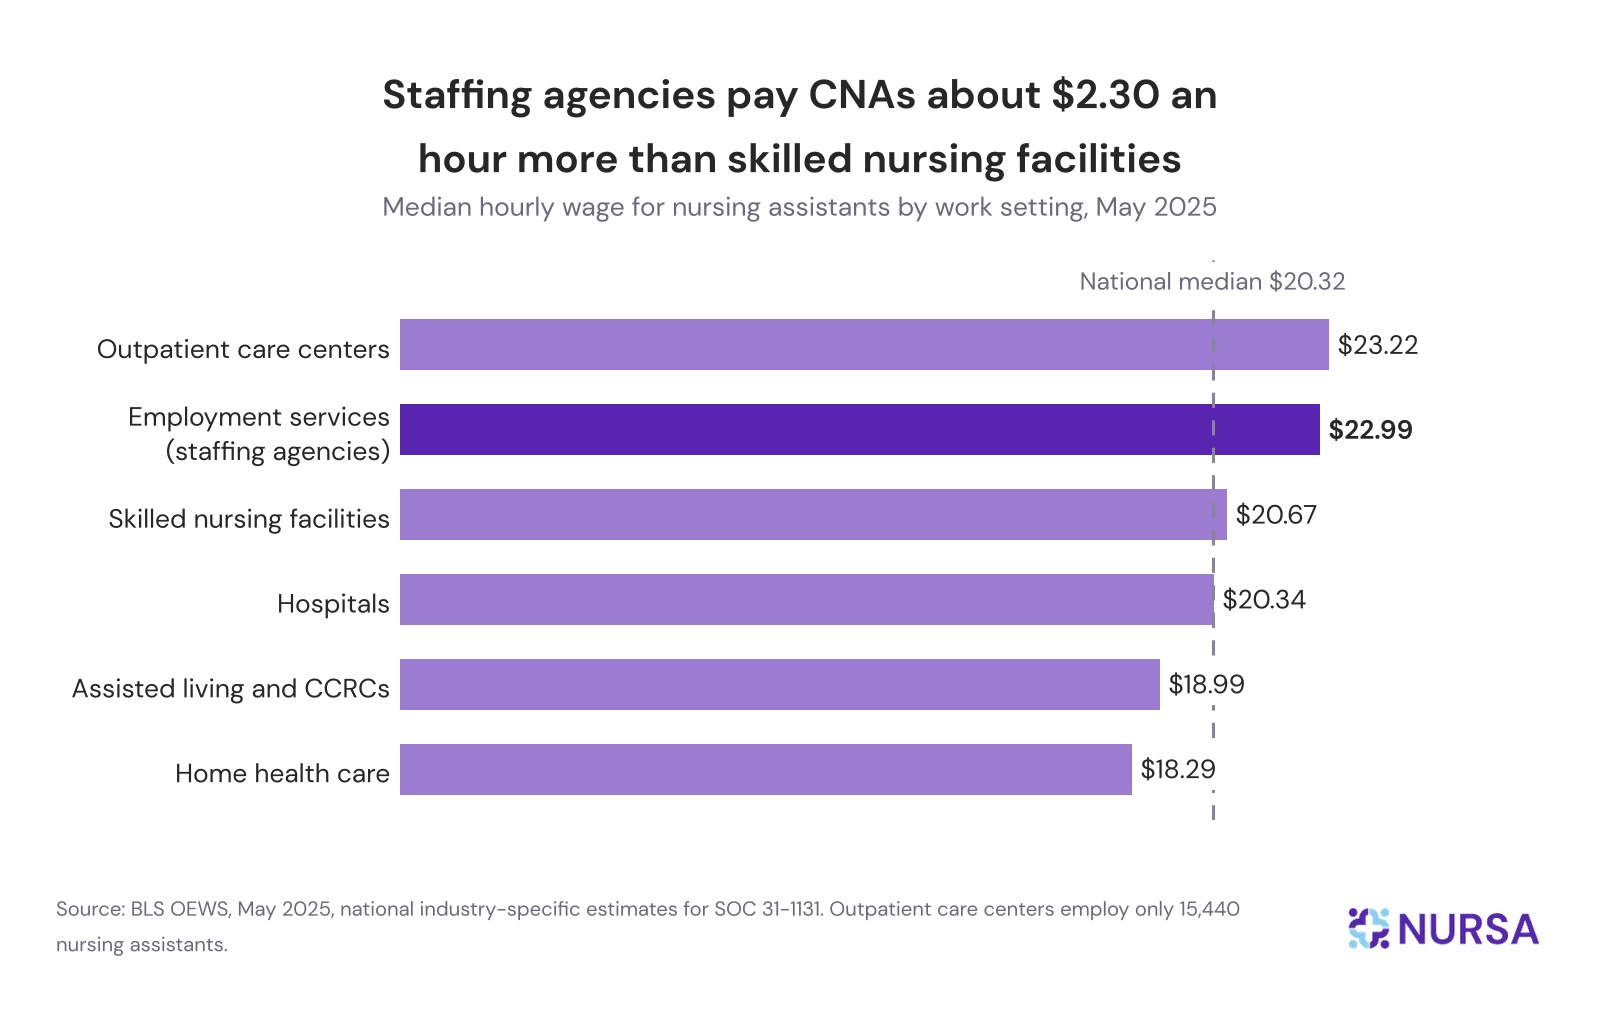
Setting drives CNA pay as much as geography does. Visual 6 shows median hourly pay by setting for May 2025. The spread between the highest- and lowest-paying mainstream settings is nearly $5 an hour.
Visual 6: CNA pay by setting
If you’re looking for turnover causes and retention strategies, consider this. A more important comparison is not between healthcare settings but between CNA work and everything else a CNA could do.
PHI's report put a national number on that comparison: nursing-home CNAs earned a median of $20.67 per hour in 2025 against $27.90 for similar occupations, a gap of $7.23. (PHI's similar occupations are jobs with comparable entry requirements across the whole economy, such as pharmacy technicians, EMTs, and HVAC technicians.)
Where CNA pay trails the local labor market
A national gap hides how different the problem looks from state to state. Nursa compared each state's CNA median hourly wage with the state's median wage for all occupations to measure how CNA pay stacks up against everything else a worker in that state could do.
In the median state, Tennessee, a CNA earns 80% of the all-occupation median wage ($18.27 against $22.78). No state pays CNAs at or above its overall median.
Visual 7: CNA pay vs all-occupation median
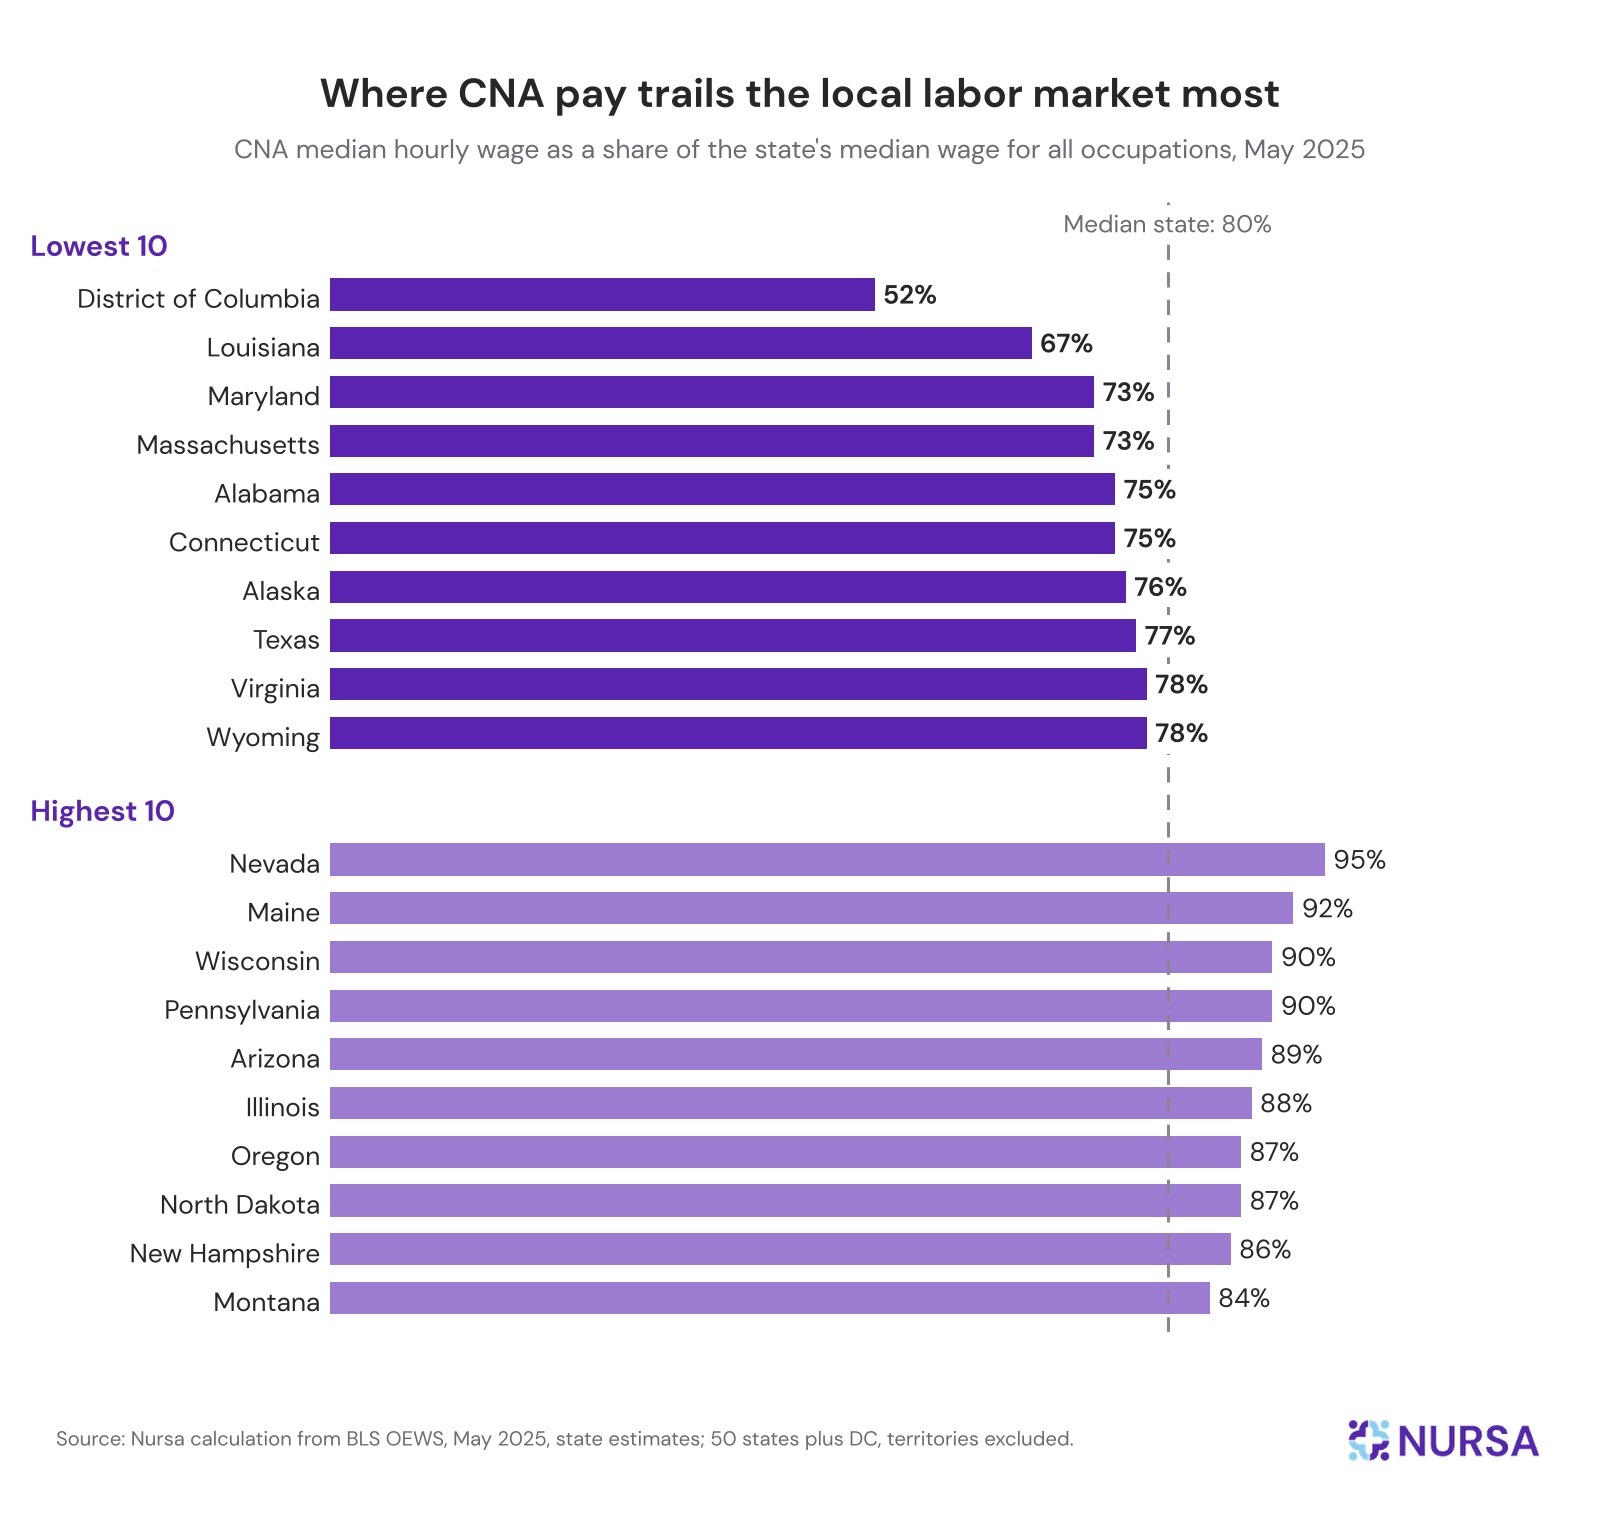
Interestingly, the lowest ratios are not necessarily where CNA pay is lowest. Louisiana combines the lowest CNA wage in the country ($14.67) with a 67% ratio. However, Maryland, Massachusetts, Connecticut, and Alaska all pay CNAs above the national CNA median and still land in the bottom 10, because their overall labor markets pay far more.
A Massachusetts facility paying the $22.44 CNA median is competing with a job market where the median wage is $30.57; a Nevada facility paying $21.87 is competing with a $22.91 median and pays 95% of it. Texas (77%) and Florida (78%) sit in the bottom third despite being 2 of the 4 largest CNA employers.
Takeaway:
For a facility, the ratio may be a better guide to retention pressure than the wage itself. Why?
Because in low-ratio states, the jobs a CNA can walk into without new training pay a visible premium over bedside care, and a raise that looks competitive against other facilities may not be competitive against the grocery chain or warehouse down the road.
What a CNA could earn next door
The same BLS 2025 data makes the comparison concrete. Nursa pulled the national median hourly wage for 13 occupations a CNA could realistically move into: 6 healthcare roles that recruit from the same pool, and 7 non-healthcare roles with similar entry requirements. Ten of the 13 pay more than the $20.32 median for CNAs. Nationally, CNAs earn 83% of the $24.51 median wage for all occupations.
Visual 8: CNA pay vs pay for similar occupations
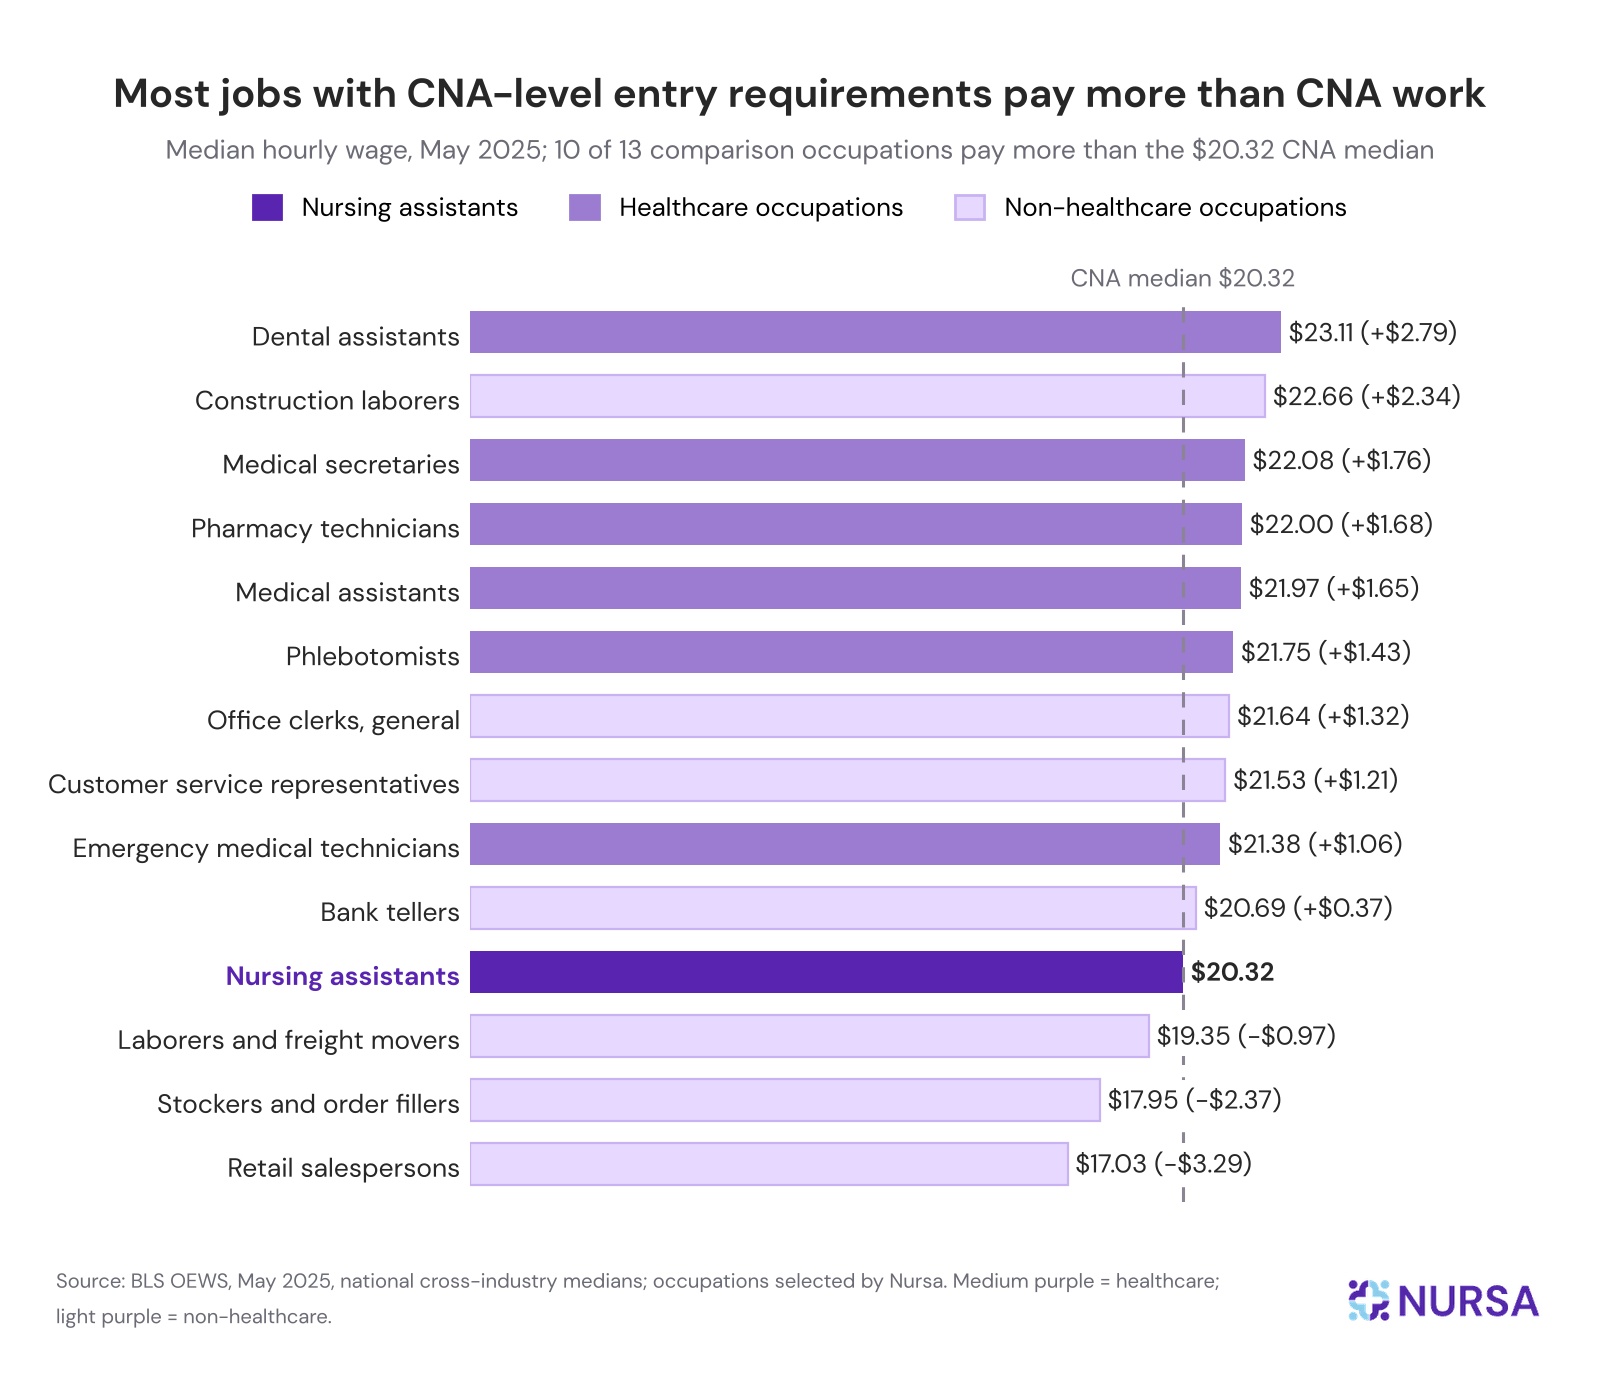
Two patterns stand out.
First, the healthcare roles that compete most directly for CNAs all pay more: dental assistants, medical secretaries, pharmacy technicians, medical assistants, phlebotomists, and EMTs. Most offer daytime hours and far less patient lifting than bedside care (EMTs are the exception on both counts). A CNA’s patient-care experience is an advantage when applying for many of them, though most require their own training program or credential.
Second, the non-healthcare jobs that pay less than CNA work (retail, stocking, freight handling) are the jobs with the weakest schedules and least stability. By contrast, the ones that pay more (office clerks, customer service, construction labor, bank tellers) offer either predictable hours or a physical-work premium.
The CNA role sits in the middle: physically demanding like the lower-paid group, credentialed like the higher-paid one, and paid closer to the former.
Takeaway: A CNA deciding whether to stay may be weighing the job against a dental office or pharmacy counter, or against what a warehouse, retail, or customer-service employer down the road will pay for work with less physical risk and more predictable hours.
Pay that closes the $1 to $3 gap with those roles, or schedule flexibility and shift access that compensate for it, may help keep experienced aides from making the move.
There is research to support acting on that pay gap, too. Pradhan et al. (2026), using CMS Payroll-Based Journal and cost report data for 2021 through 2023, found that each $1 increase in facility-level CNA hourly wages was associated with a 0.35 percentage-point reduction in CNA turnover. Interestingly, the same study found no comparable wage effect for RN or LPN/LVN turnover. Wage increases, in other words, appear to retain CNAs specifically.
Who CNAs are
The CNA workforce is overwhelmingly female and more racially diverse than the U.S. workforce as a whole.
Visual 9: CNA demographics compared
Source: BLS Current Population Survey, 2025. Race categories do not sum to 100 because other races are not shown; Hispanic or Latino workers may be of any race.
Within nursing homes, PHI's analysis of 2024 American Community Survey data puts the median CNA age at 38 and found:
- 21% are aged 16 to 24, compared with 14% of the total labor force
- 60% are people of color, including 35% who are Black and 14% who are Hispanic
- 22% are immigrants
- 25% are multilingual
- 33% have a child under 18 at home
- 44% have pursued education beyond high school
Each of those facts points to a potential recruiting or retention lever.
- A young workforce is a workforce that leaves for school, for other entry-level jobs, and for better-paying work in the first few years, which argues for structured career ladders and tuition support rather than sign-on bonuses alone.
- A workforce where a large cohort is multilingual and/or foreign-born is a workforce that may respond to language access in onboarding and compliance materials.
- A workforce where a third are parents of minors is a workforce for whom schedule predictability, shift-swap flexibility, and the ability to pick up or drop shifts around childcare are worth real money.
Work patterns, workload, and workforce stability
Retention is where hours, pay, physical risk, and workload converge. A CNA who works part-time or part-year earns less in a year than the hourly wage suggests, carries one of the highest injury rates in the economy, and is typically responsible for about 11 residents at a time.
No federal survey tracks CNA burnout or intent to leave, so the stability picture has to be assembled from employment status, income, injury, and turnover data.
Hours, income, and economic strain
PHI's analysis of 2024 American Community Survey data shows how nursing-home CNAs' hours translate into income.
Work schedule:
- 65% work full-time, full-year
- 27% work part-time (fewer than 35 hours per week)
- 17% are employed only part of the year
- 13% typically work more than 40 hours a week
Income and economic strain:
Because so many CNAs only work part of the year or part-time, their actual median annual income is $32,488, about $10,500 below the $42,994 a nursing-home CNA would earn working full-time, year-round at the $20.67 median wage.
- 10% live below the federal poverty line
- 33% live in low-income households
- 41% rely on some form of public assistance
- 32% are housing cost-burdened
- 14% have no health insurance
Takeaway:
A facility that can offer consistent full-time hours, or that lets part-time CNAs pick up additional shifts, could help reduce economic strain on CNAs, without changing the hourly rate.
Workload and share of care
CNAs make up about 33% of the nursing-home workforce but provide up to 90% of direct resident care, as cited in Dobbs et al. (2025). That figure counts hands-on tasks such as bathing, feeding, and helping residents move. It’s higher than CNAs’ share of nursing hours, because those hours also include the time RNs and LPNs spend on assessments, medications, and documentation.
An analysis of the September 2026 CMS Care Compare Provider Information file shows what that looks like in staffing hours:
- The median nursing home reports 2.22 nurse aide hours per resident day, 0.85 LPN hours, and 0.58 RN hours, yielding a facility-level median total of 3.68 nursing hours (category medians are independent and do not sum directly).
- Nurse aides account for about 60% of nursing hours at the median facility, which works out to roughly 11 residents per aide on an 8-hour shift.
- Only about a third of nursing homes currently report nurse aide staffing at or above the 2.45 hours per resident day that the repealed 2024 federal standard would have required.
Injury and turnover
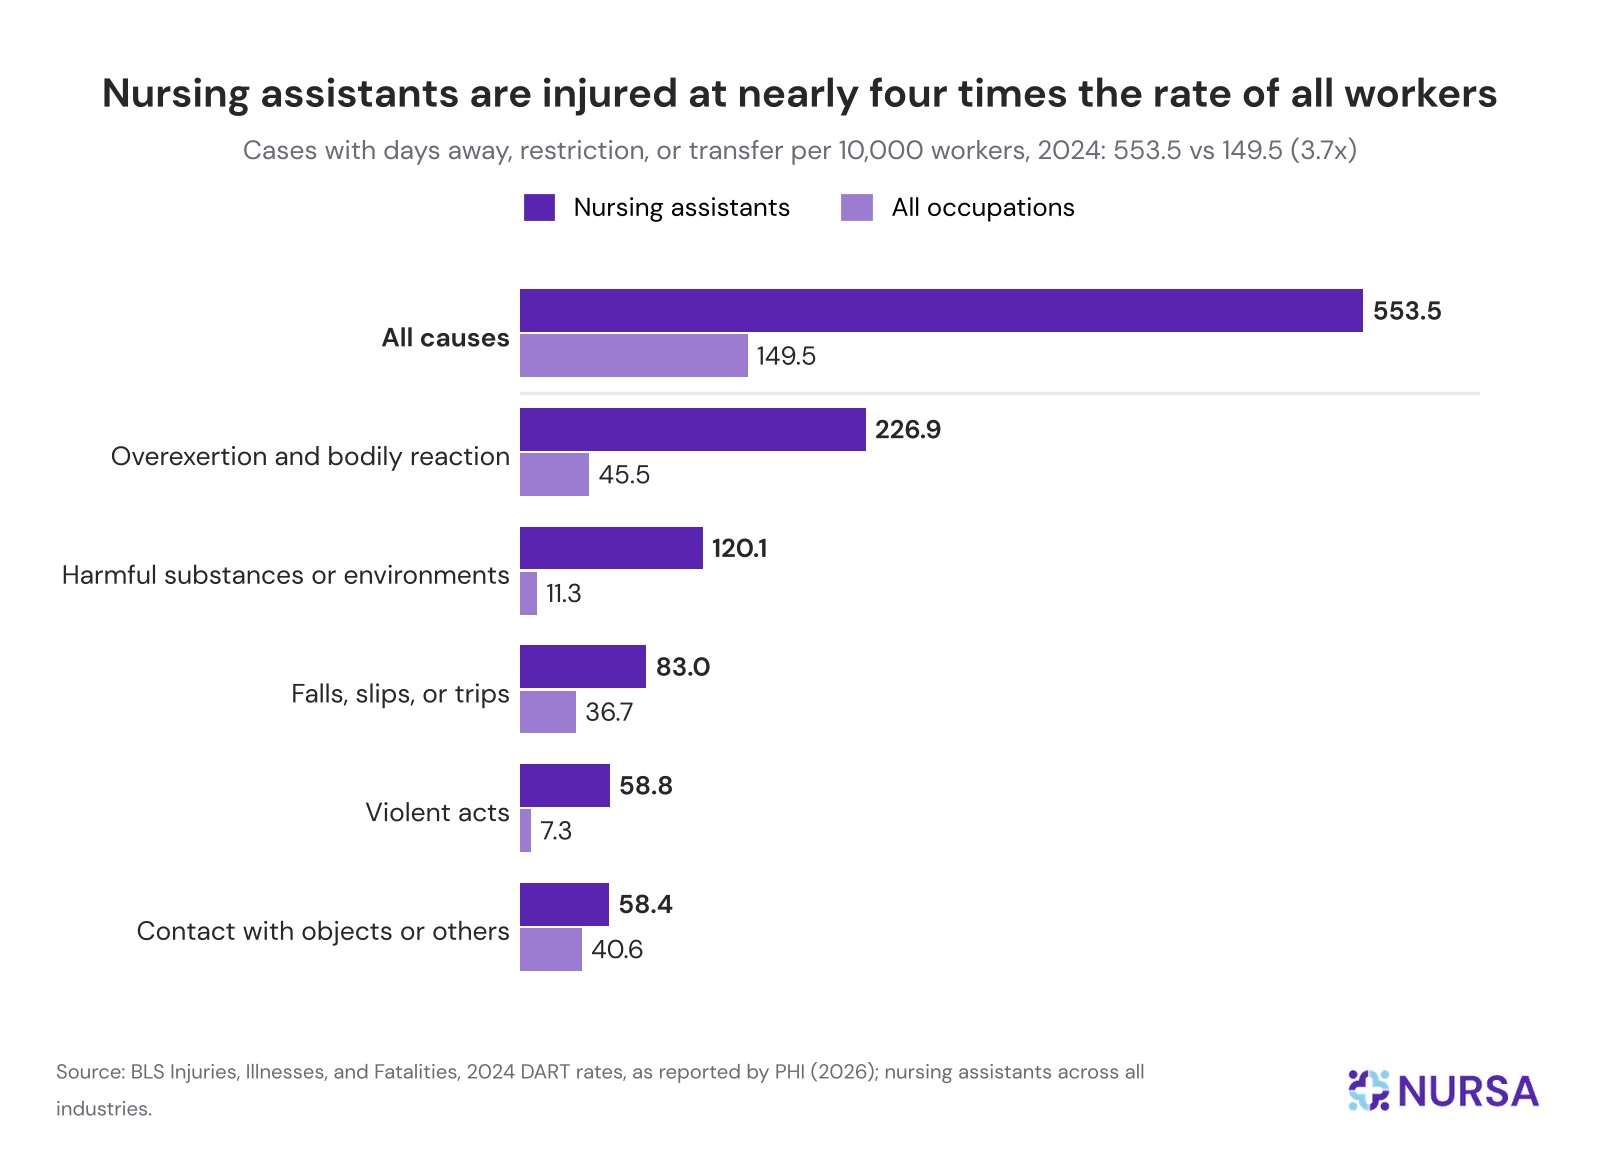
According to the BLS Injuries, Illnesses, and Fatalities program's 2024 data, nursing assistants across all industries had 553.5 injury and illness cases involving days away from work, job restriction, or transfer per 10,000 workers.
That's nearly 4 times the rate for all occupations. For the typical injured nursing assistant, that injury meant 10 days away from work or on restricted duty (the median across all DART cases, so half of injuries cost more time than that).
Visual 10: CNA injuries
Turnover data for CNAs specifically is limited. CMS does not publish a CNA-only turnover rate; its Care Compare measures combine RNs, LPNs, and nurse aides into a single total nursing staff turnover figure.
Nursa's calculation from the September 2026 Care Compare Provider Information puts the average facility's total nursing staff turnover at 45.8% (median 44.9%) across 13,538 nursing homes reporting the measure.
The calculation is a simple average:
Sum of each facility's total nursing staff turnover (620,227 percentage points) ÷ number of facilities reporting (13,538) = average facility nursing staff turnover (45.8%)
Each facility's own percentage comes from CMS, which uses Payroll-Based Journal records to measure the share of a facility's nursing employees (RNs, LPNs, and nurse aides) who stopped working there during a 12-month period. Because Pradhan et al. found CNA turnover more wage-sensitive than licensed-nurse turnover, the CNA-specific rate is likely above the blended figure at most facilities.
Federal staffing minimums: What changed in 2026
The federal minimum staffing standards CMS finalized in May 2024 (0.55 RN, 2.45 nurse aide, and 3.48 total nurse staffing hours per resident day, plus a registered nurse on site 24 hours a day) never took effect.
Section 71111 of Public Law 119-21, signed July 4, 2025, barred HHS from implementing or enforcing them through September 30, 2034. CMS then repealed the requirements by interim final rule, effective February 2, 2026, restoring the prior standard at 42 CFR 483.35: facilities must have sufficient nursing staff with the appropriate competencies to meet residents' needs, as determined by the facility assessment required at 42 CFR 483.71.
CMS estimates that removing the RN and nurse aide hour requirements saves facilities about $3.3 billion a year.
State staffing minimums still apply. As the Care Compare analysis above shows, only about a third of nursing homes were reporting nurse aide staffing at or above the 2.45 threshold when it was withdrawn.
Are CNAs in demand?
Yes. Demand for CNA hours in long-term care is projected to grow through 2038. The driver is demographic. PHI, citing Census Bureau projections, notes that the U.S. population aged 65 and over is expected to grow from 57.8 million to 88.8 million between 2022 and 2060, and the 85-and-over population, the group most likely to need daily hands-on care, is expected to nearly triple.
Long-term care demand projections
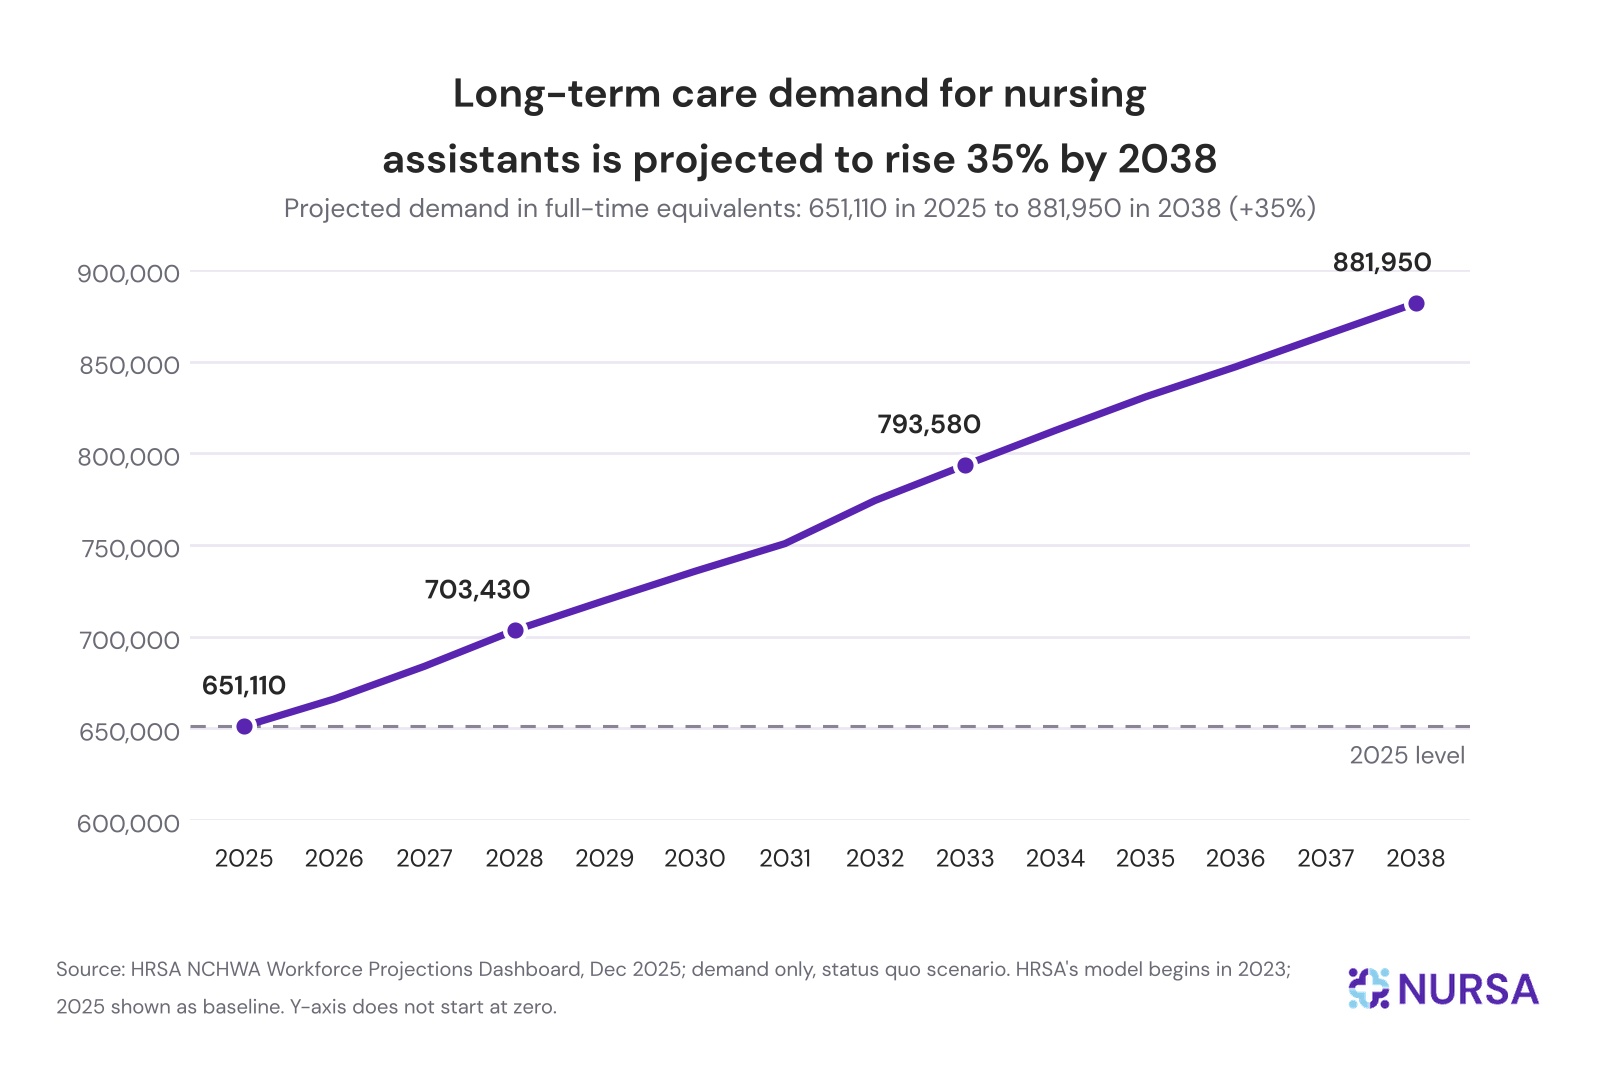
HRSA's Health Workforce Simulation Model projects demand for nursing assistants in long-term care to rise from 651,110 full-time equivalents in 2025 to 881,950 in 2038, a 35% increase.
Demand across all long-term care occupations that HRSA models is projected to grow 33% over the same period, from about 2.48 million to 3.29 million FTEs. Nursing assistants are the largest of those occupations, at 26% of 2025 long-term care demand, and their projected growth outpaces the overall rate.
Projected growth in demand of the largest long-term care occupations, 2025 to 2038:
- Nursing assistants: +35%
- LPNs/LVNs: +33%
- RNs: +32%
- Personal care aides: +31%
- Home health aides: +29%
Visual 11: CNA demand in long-term care, 2025–2038
Job openings and replacement hiring
BLS projections for nursing assistants, 2025 to 2035:
- Employment growth: 39,000 new jobs over the decade, from 1,505,900 to 1,544,900 (3%, about average for all occupations)
- Yearly job openings: 203,300 nursing assistant and orderly openings a year across all work settings, many of them to replace workers who move to other occupations or leave the labor force
- Replacement vs. new: Roughly 50 existing positions refilled for every new one created (203,300 openings a year ÷ 3,900 net new jobs a year ≈ 52)
Note: The yearly job openings figure is the BLS's combined number for nursing assistants and orderlies; orderlies are 52,800 of the 1,558,700 total, so the figure is effectively nursing assistants.
What the data means for healthcare facilities
Read together, the data describe a workforce that is not shrinking so much as churning: roughly flat headcount, hundreds of thousands of openings a year, a wage gap that pulls workers toward other sectors, and a regulatory floor that has moved from a fixed number to a facility-specific judgment. The implications fall into 3 areas.
Plan for replacement hiring
Because nearly all projected openings are replacement openings, the constraint on most facilities isn’t finding candidates once but absorbing a steady flow of new hires without degrading care. That makes orientation capacity, preceptor load, and first-90-day retention the operational metrics that matter more than time-to-fill.
The demographic profile sharpens the point: a young, diverse, often multilingual workforce with caregiving responsibilities at home will stay for predictable or flexible schedules, visible career ladders, and supportive onboarding.
Hospitals face the same replacement dynamics with a smaller share of the workforce.
Close the wage gap where it moves retention
Wage research gives facilities an unusually precise lever. Research found that CNA turnover responds to CNA wages, whereas licensed-nurse turnover does not, meaning a dollar of the wage budget retains more staff when it goes to aides.
Benchmarking against the occupation's national median is the wrong comparison; the $27.90 that jobs with comparable entry requirements pay is the number CNAs weigh.
Where the hourly rate cannot move, annual income still can, through consistent full-time hours and reliable access to additional shifts.
Use contingent capacity and coverage data deliberately
With nearly half of nursing staff turning over each year and replacement hiring outnumbering new positions 50 to 1, almost every facility will need flexible capacity at some point; the question is what form it takes.
Agency contracts carry a markup on top of the roughly $2.30 per hour agency wage premium (Visual 6). Direct marketplace connections offer that same flexibility via per diem clinicians, while shift blocks and in-house placements allow facilities to convert reliable CNAs into permanent staff.
With federal HPRD minimums repealed, staffing adequacy now rests on the sufficient-staff standard and the facility assessment, which puts the burden on each facility to show, with its own data, that CNA hours match resident acuity. Scheduling, marketplace, and compliance tools built to work together make that visibility routine.
Where the CNA workforce goes from here
The next decade of CNA staffing will be decided less by how many people enter the occupation than by how long they stay. Demand for CNA hours in long-term care is set to rise by more than a third, while the number of CNA jobs barely moves, which means the same workforce will be asked to deliver far more care unless retention improves.
The levers that work are now reasonably well documented: wages that close the gap with comparable jobs, hours that turn an hourly rate into a livable annual income, schedules that respect caregiving at home, and onboarding that gets a new aide through the first 90 days. None of them requires a federal mandate, and with the federal staffing standard gone, none of them will be forced.
The facilities that come through this period well will be the ones that treat their CNA data as a management tool rather than a reporting obligation: hours per resident day tracked against acuity, turnover watched by unit and tenure, contingent coverage used by design rather than by default, and certification status visible before a shift starts. The federal datasets in this report describe the national workforce once a year.
The facility-level version of the same picture is available every day to any organization that chooses to look.
Know your CNA coverage before the survey does. See how Central Staffing gives you shift-level visibility into nurse aide hours and credential status, so staffing adequacy is something you can show, not just assert.
Sources:
- CMS: Nursing homes including rehab services datasets
- BLS: May 2025 National Industry-Specific Occupational Employment and Wage Estimates
- BLS: Occupational Employment and Wage Statistics (OEWS) Tables
- BLS: Employed people by detailed occupation, sex, race, and Hispanic or Latino ethnicity (Current Population Survey, 2025)
- Nursing Assistants and Orderlies: Occupational Outlook Handbook
- Direct Care Workers in the United States: Key Facts 2026 - PHI
- Nurse Workforce Projections, 2023-2038
- Medicare and Medicaid Programs: Repeal of Minimum Staffing Standards for Long-Term Care Facilities
- Dobbs A, Taylor M, Lott A, et al. A Looming Disaster: The Certified Nursing Assistant Staffing Shortage
- Pradhan R, Ghiasi A, Davlyatov G, Weech-Maldonado R. Heterogeneous effects of nursing staff wages on turnover: evidence from U.S. nursing homes using an instrumental variable approach
- U.S. Bureau of Labor Statistics: Injuries, Illnesses, and Fatalities

