


The last 29 years have seen significant change across all medical environments, with a high demand and a low supply of nurses, a situation that has been felt nationwide, particularly in recent years. Like in any market, supply and demand play a huge role in determining the cost of certain products or labor rates.
This report is a look at over one quarter of a century in nursing salary history: a detailed exploration of the wages of registered nurses (RNs), licensed practical nurses (LPNs), nurse practitioners (NPs), certified nurse-midwives (CNMs), and certified registered nurse anesthetists (CRNAs). These nursing roles are the backbone of the healthcare industry.
About the data: Salary data was sourced from the U.S. Bureau of Labor Statistics (BLS). The BLS publishes salary data annually. Data in this report span the 1997-2025 period, although salary figures for nurse practitioners, certified nurse-midwives, and certified registered nurse anesthetists were only added to the annual BLS reports as separate occupations in 2012.
The big picture: Then versus now
How much do nurses make, and how much has that number changed over the years?
Every nursing role earns far more today than it did at the start of its record, and the pace of nurse salary growth accelerated sharply after 2020.
The table below shows each role's first recorded median, its 2025 median, and the total percent change, capturing nursing salaries over the years in a single view.
Nurse salary growth from the first recorded median to 2025
Chart 1: Median annual wage by nursing role, 2012 to 2025
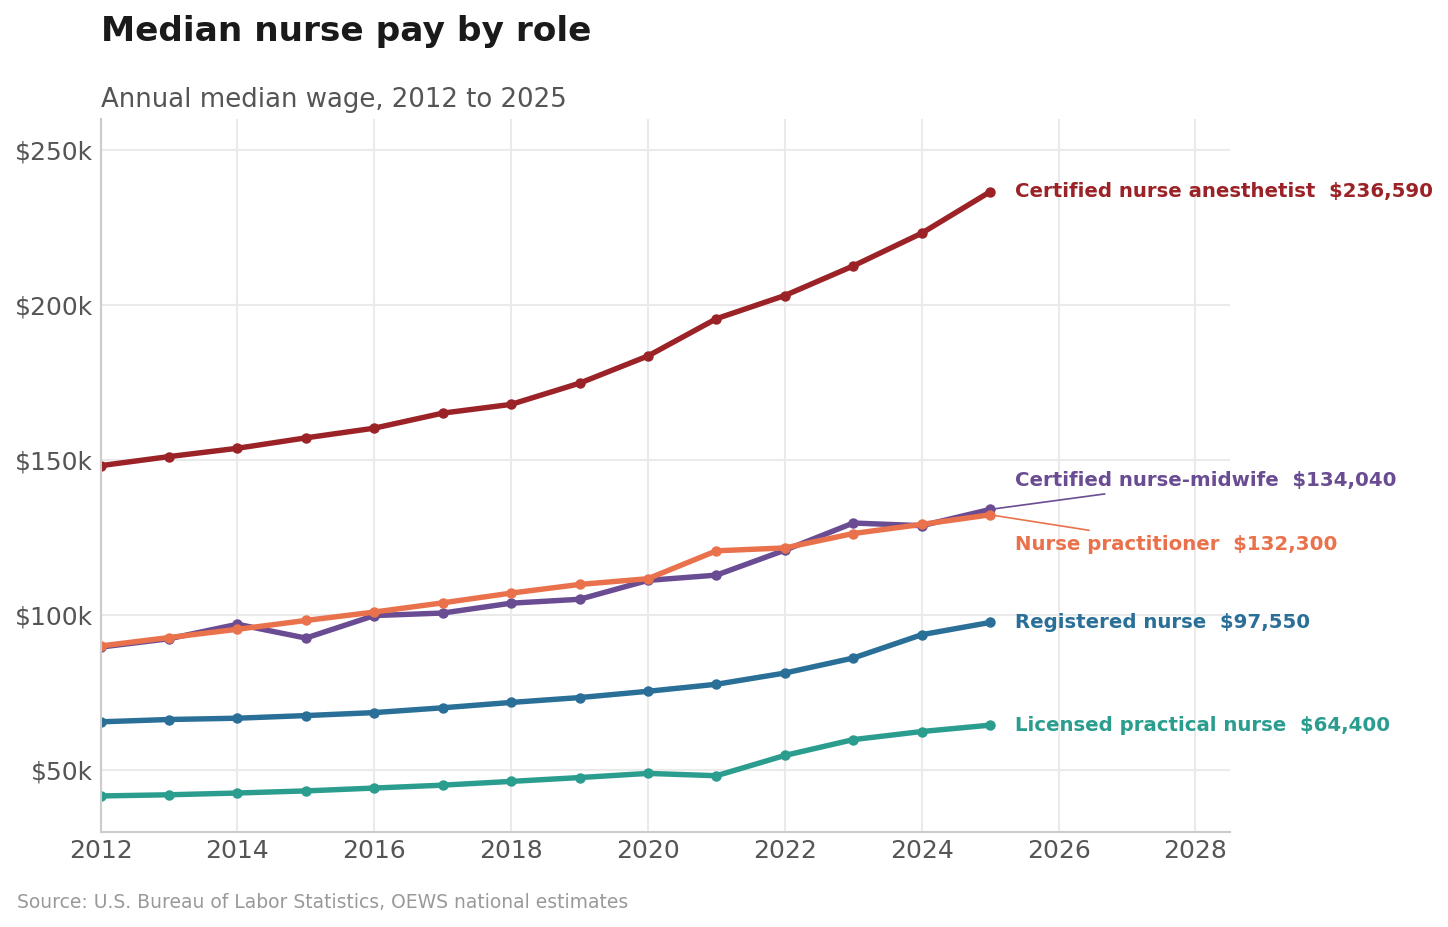
Registered nurse and licensed practical nurse pay both grew about 148% across the full 28-year span, a near-identical climb from very different starting points. The sharpest nurse wage trends show up after the pandemic, when demand for bedside and long-term care staff surged, and wages followed.
Pay also depends heavily on where a nurse works. State averages can swing tens of thousands of dollars around the national number, and the highest-paying states for registered nurses are led by California, which posted the highest average in 2025 at roughly $150,000. The highest-paying states for licensed practical nurses are led by the state of Washington, with the highest average in 2025 at around $83,000.
Viewing the average nurse salary over time at the national level smooths out those geographic gaps, but any single paycheck still shifts with location, setting, and experience.
How each nursing role grew
Each nursing role tells its own story, so here is the view behind the totals, one role at a time.
Licensed practical nurses
From 1997 to 2010, licensed practical nurses saw steady, gradual gains. Then they waited nearly a decade for a real raise: the median crept up just $6,330 across the entire 2011 to 2019 stretch.
Then the rebound arrived, and it was steep.
- 2021-2023: LPN median pay jumped 24%, as nursing homes and home-health employers competed for scarce staff.
- 2024-2025: By 2025, the LPN median hit $64,400, nearly catching up to the 10th percentile RN pay ($68,940).
Chart 2: LPN 10th percentile, median, and 90th percentile, 1997 to 2025
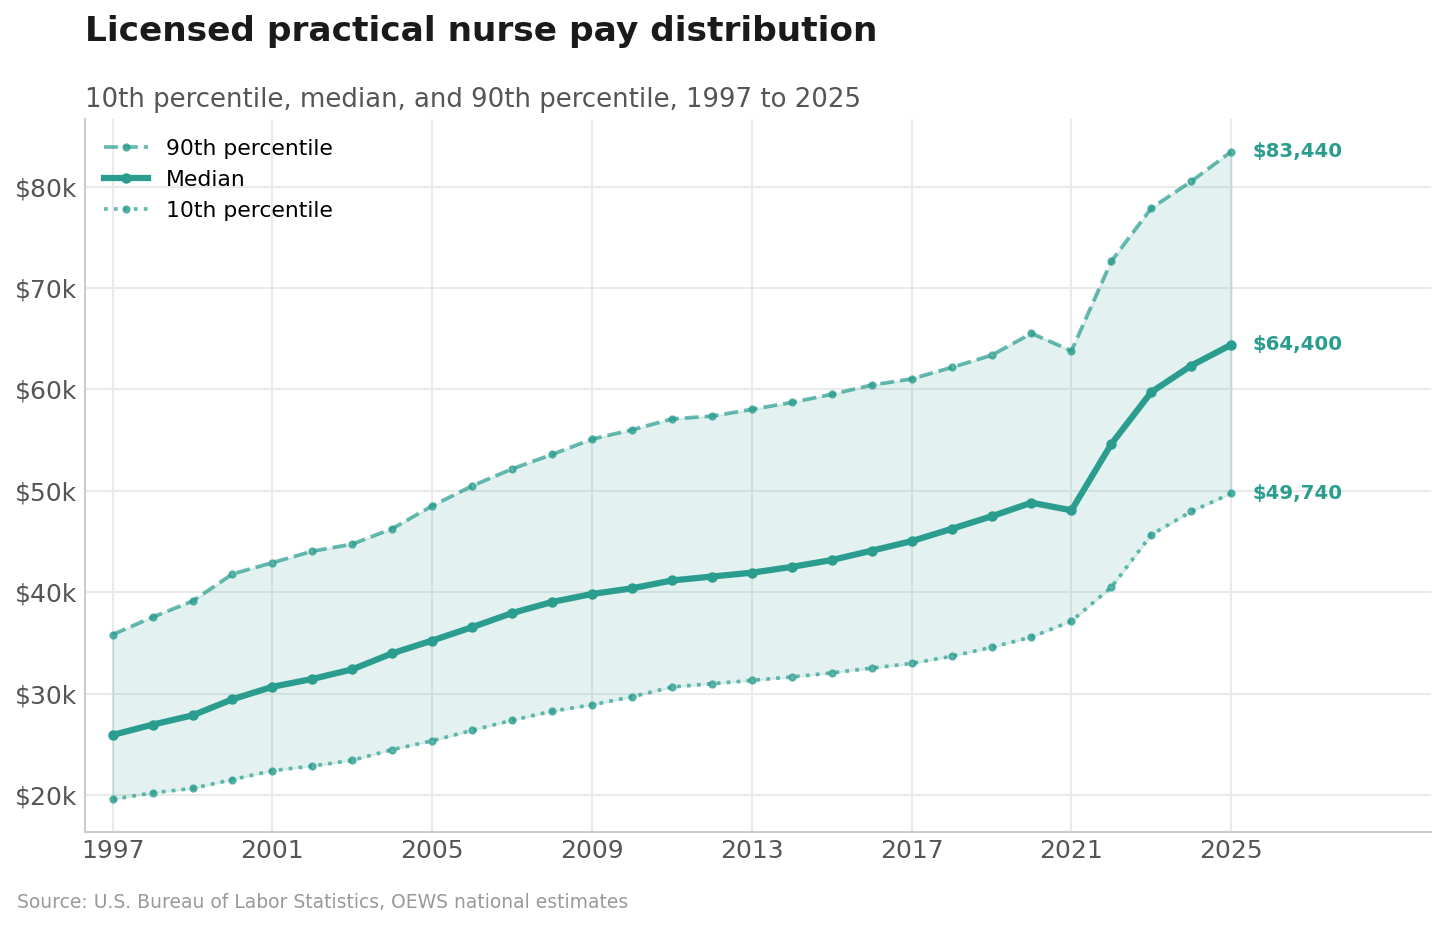
The gains reached the bottom of the pay scale, not only the middle. Consider how the distribution shifted over the course of 28 years:
- The 10th-percentile LPN wage rose from $19,573 to $49,740 in 2025, a 154% climb that outpaced the median.
- The 90th percentile grew from $35,818 to $83,440, up 133%, so the best-paid LPNs now earn more than triple what the typical LPN made in 1997.
- The dollar gap between top and bottom earners doubled, but the ratio narrowed from 1.83 to 1.68, meaning the bottom of the LPN pay scale climbed faster than the top.
That ratio is calculated by dividing the 90th percentile by the 10th, showing how many times more the best-paid tenth earned than the lowest-paid tenth. In general, a narrowing ratio means the floor rose faster than the ceiling, and a widening ratio means the ceiling rose faster than the floor. Either can happen while the dollar gap grows, because the ratio tracks percentage change rather than dollars.
Registered nurses
The registered nurse anchors the entire dataset as the largest nursing role by a wide margin (3,379,720 employed, per BLS). Tracking RN salary over time reveals 3 distinct phases.
- 1997-2011: Growth was steady but modest, adding roughly $1,900 to the median each year
- 2012-2017: A plateau followed, when the median barely moved
- 2018-2025: Big, quick gains by 2025 as the RN median rose from $71,730 to $97,550, packing more growth into 7 years than the prior 10 years
Chart 3: RN 10th percentile, median, and 90th percentile, 1997 to 2025
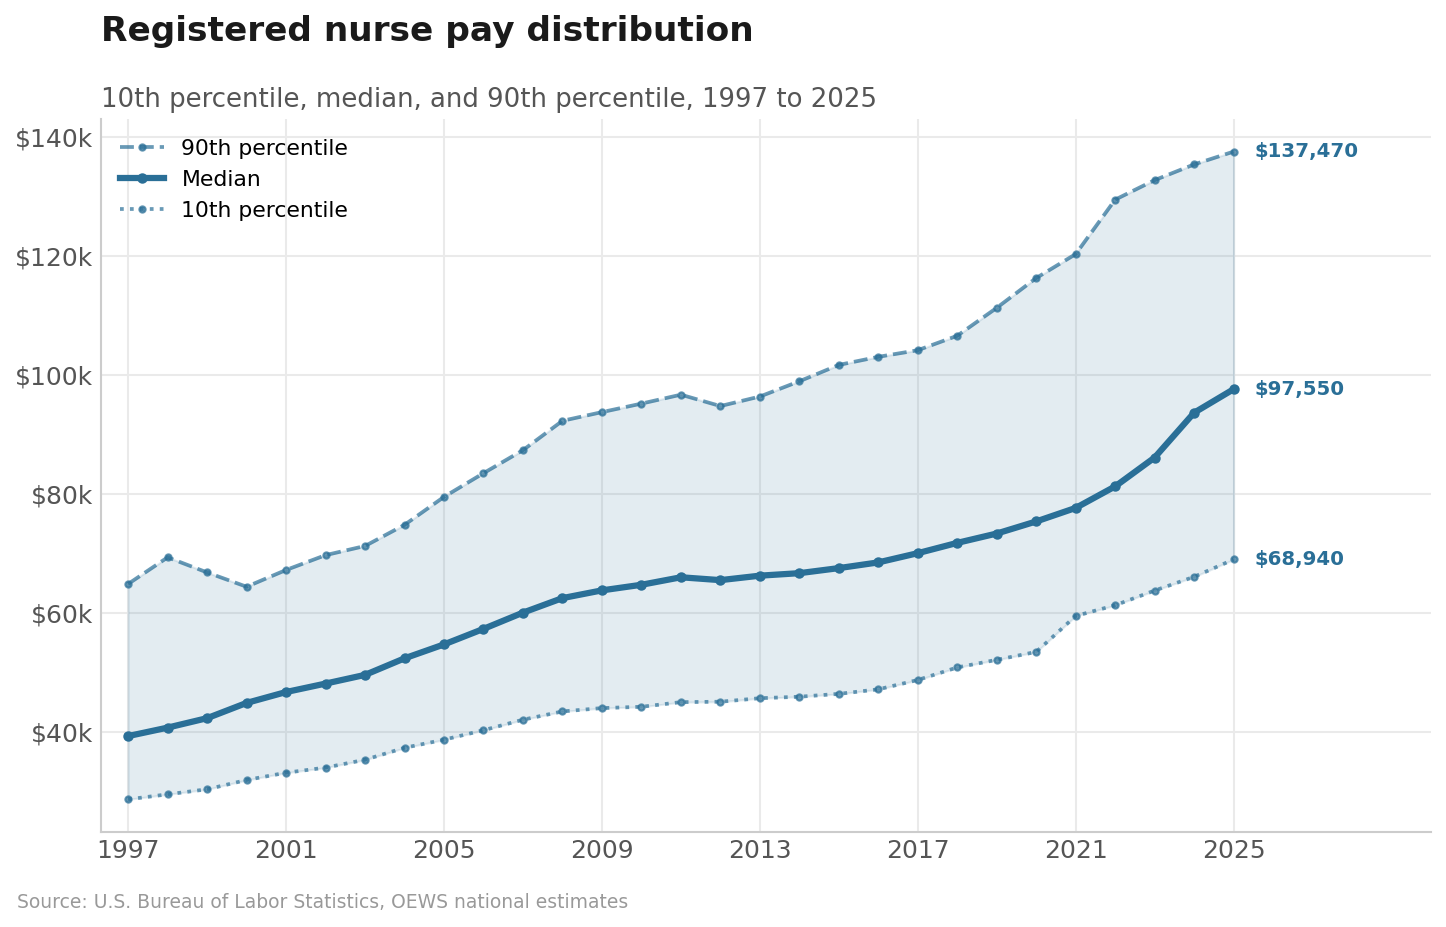
The distribution matters as much as the median:
- The floor is rising: 10th-percentile RN wage climbed from $28,642 in 1997 to $68,940 in 2025, a 141% gain.
- The ceiling is expanding: 90th percentile RN wages rose from $64,834 to $137,470, a 112% gain.
The dollar gap between the top and bottom earners widened, from about $36,000 to nearly $69,000. Yet the ratio narrowed from 2.26 to 1.99. In plain terms, the post-pandemic raises lifted the bottom of the RN scale faster than the top.
Those salary lifts at the bottom matter for anyone entering the field.
When the bottom of the scale rises faster than the top, a new nurse starting at the 10th percentile is not stuck watching only the highest earners pull away. The whole ladder moved up, which is a healthier sign than growth that only concentrates at the very top.
Nurse practitioners
The nurse practitioner occupation has posted some of the steadiest gains in the dataset. Charting nurse practitioner salary over time shows an average climb of about $3,200 a year since 2012.
There are 2 forces driving that momentum:
- The steady expansion of full practice authority across more states
- The persistent shortage of primary care physicians that pushes more patients toward NPs
The steepest single-year jump came between 2020 and 2021, when the median rose $9,000.
Chart 4: NP 10th percentile, median, and 90th percentile, 2012 to 2025
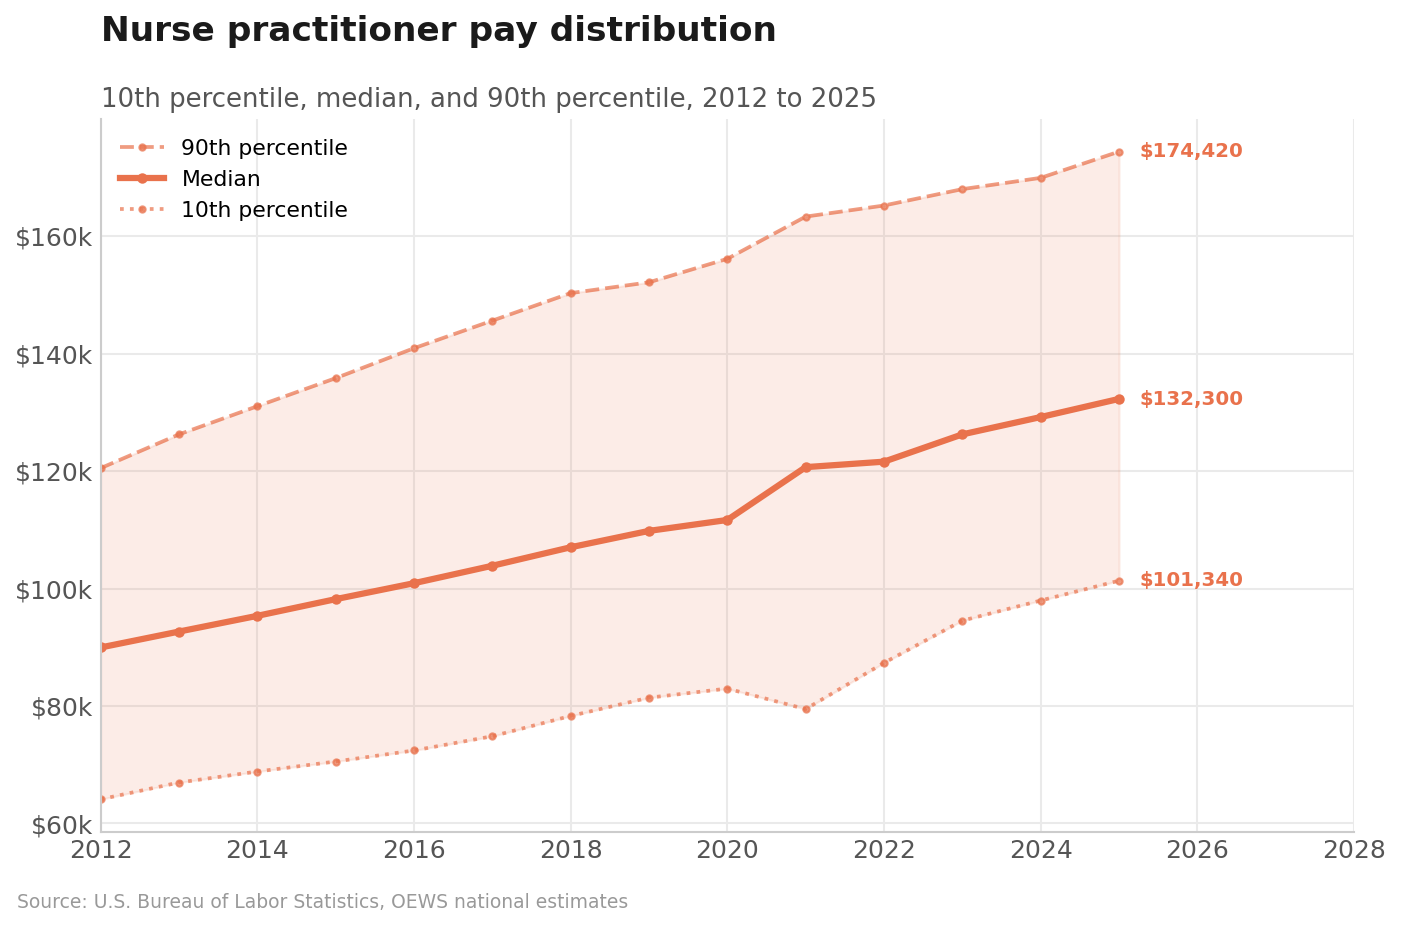
Both ends of the NP scale rose, but not evenly.
- The 10th-percentile NP wage grew 58% from 2012 to 2025 ($64,100 to $101,340), so even the lowest-paid tenth of NPs now earn six figures.
- The 90th percentile rose 45% ($120,500 to $174,420), a slower climb that narrowed the ratio from 1.88 to 1.72.
Certified nurse-midwives
The certified nurse-midwife traces a broadly upward line from 2012 to 2025, reaching a record median of $134,040 in the final year. Two soft spots appear along the way, a dip in 2015 and a slight pullback in 2024.
Those wobbles reflect wide margins of error in a very small occupation, not real pay cuts. (As of 2025, the BLS put total national employment of nurse midwives at only 7,920.) The small size makes the year-to-year percentile bands jumpy, so the endpoints tell a cleaner story than any single interior year.
Chart 5: CNM 10th percentile, median, and 90th percentile, 2012 to 2025
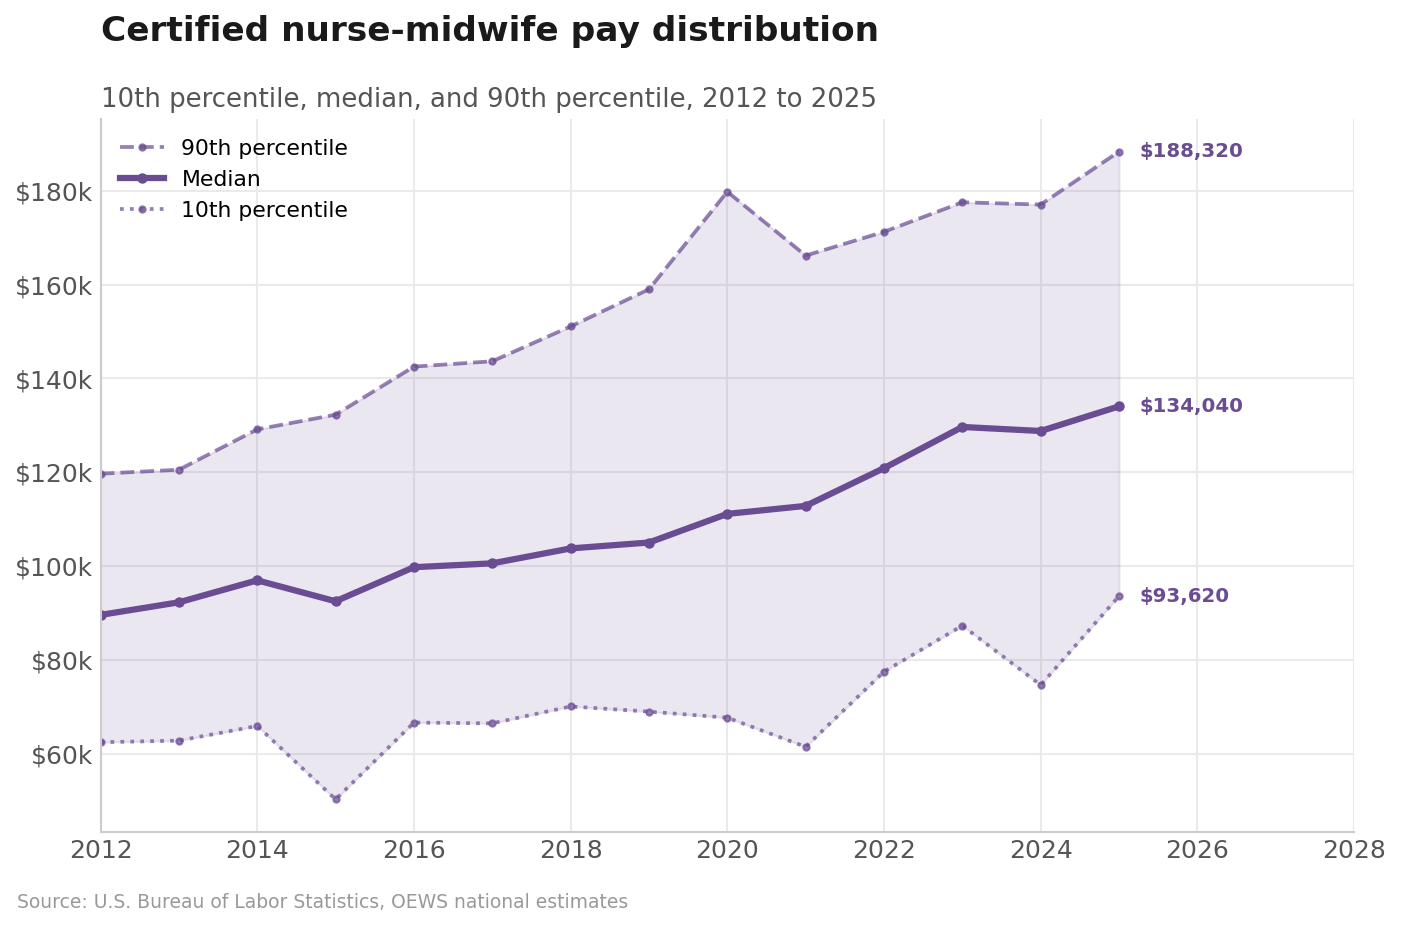
Across the full window, the distribution shifted upward at every level, though not by equal amounts.
- The 10th-percentile CNM wage rose from $62,480 to $93,620 in 2025, a 50% gain that closely tracked the median.
- The 90th percentile climbed faster, from $119,690 to $188,320, up 57%, meaning the top of the midwife pay scale pulled slightly ahead.
- The dollar gap between top and bottom grew from about $57,000 to nearly $95,000, and the ratio widened from 1.92 to 2.01.
Certified registered nurse anesthetists
The certified registered nurse anesthetist has held the title of highest earner for the entire tracking period. It is, by a wide margin, the highest-paying nursing specialty in the federal data.
- Tracking CRNA salary history shows a total median increase of $88,430 from 2012 to 2025.
- More than half of that increase, about $53,000, came between 2020 and 2025.
This is the nursing role where pay is climbing the fastest in dollar amounts and pulling away from the rest of the nursing field.
Chart 6: CRNA 10th percentile, median, and 75th percentile, 2012 to 2025
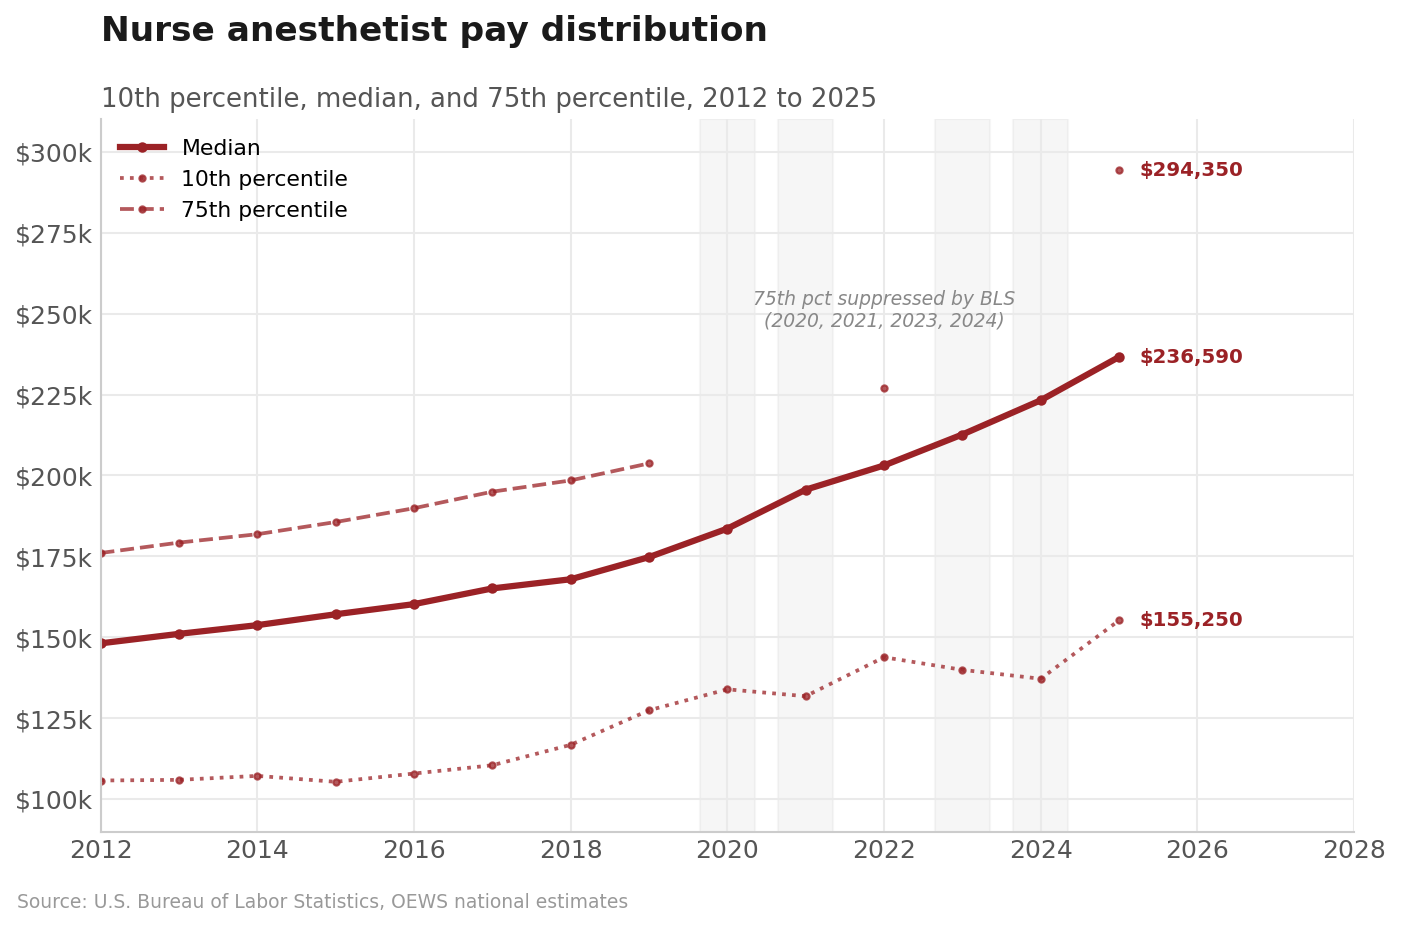
The BLS didn’t publish the CRNA 90th percentile in most years because the figure exceeded its reporting ceiling, and even the 75th percentile wasn’t published in 2020, 2021, 2023, and 2024.
The 75th percentile serves as the upper reference (albeit incomplete) for this trend, meaning the ratio for this role can only be measured at its 2025 endpoint rather than over the full period.
The CRNA wage distribution stands apart from the other nursing roles. Look at how far the numbers reach:
- The 10th-percentile CRNA wage rose from $105,810 in 2012 to $155,250 in 2025, up 47%, and even that floor tops the median pay of every other role on this list.
- The 75th percentile rose sharply from $176,060 to $294,350, a 67% gain.
- The gap between the 10th and 75th percentiles nearly doubled, from about $70,000 to $139,000, making CRNA the role where the pay distribution is widening fastest.
- In 2025, for the first time, the BLS published a 90th-percentile CRNA wage of $339,500.
- In that single year, the ratio between the 10th and the 90th percentiles stood at 2.19, the widest of any role in this report.
Which nursing role grew the fastest?
To compare fairly, all nursing roles are lined up against the same 13-year window from 2012 to 2025.
Certified registered nurse anesthetists led at +60%, with LPNs next in line, but the ranking is less interesting than what sits underneath it.
Chart 7: percent median salary growth by role, 2012 to 2025
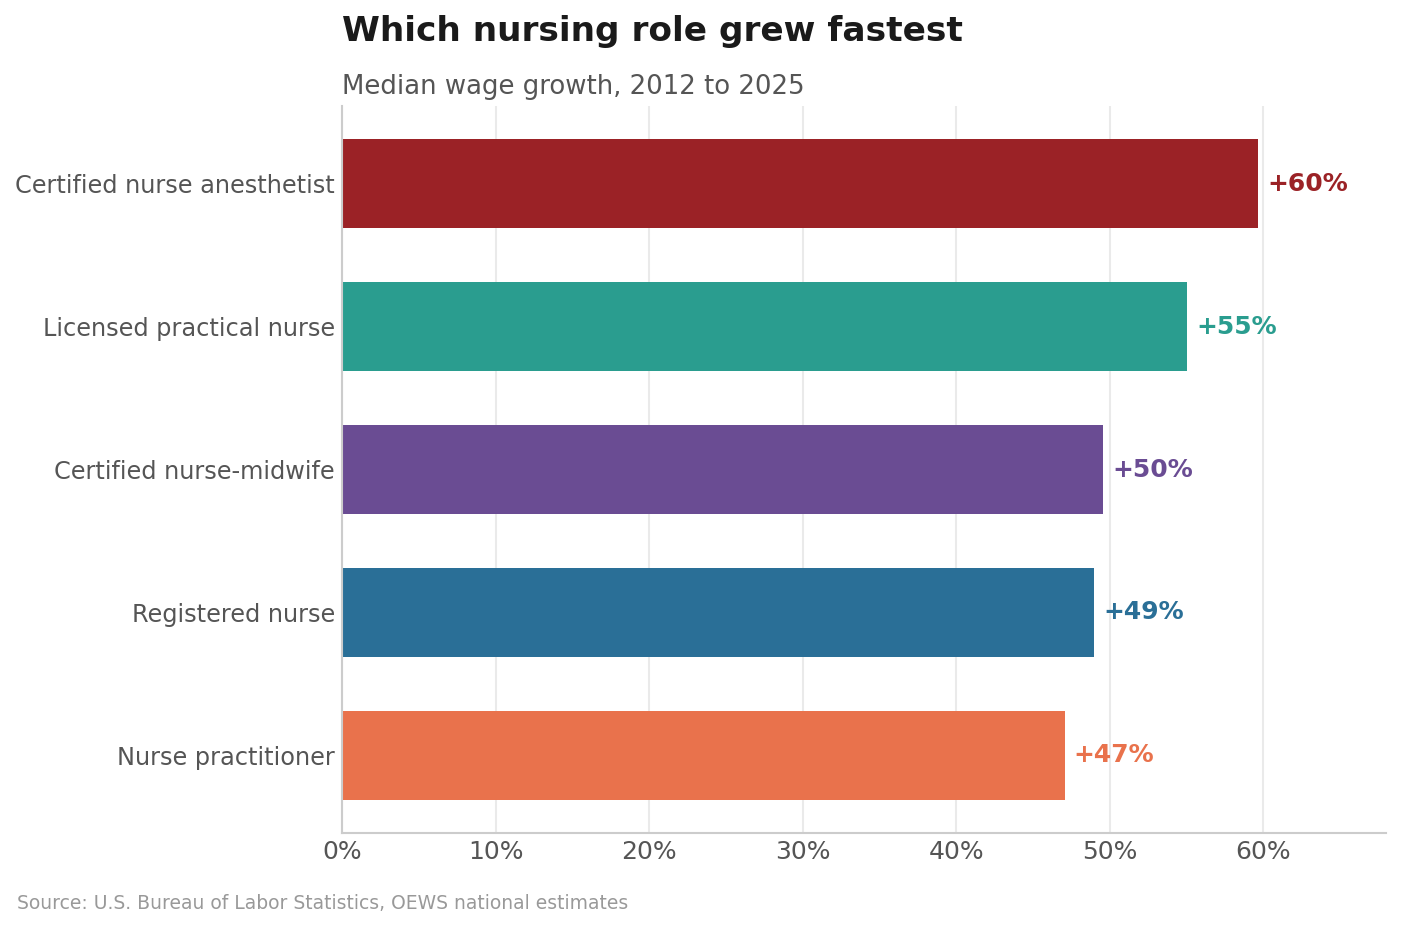
One caveat: Median growth is not the same as a raise. These figures track what the occupation pays, while an individual nurse's pay also climbs with experience and tenure.
- Starting pay didn’t predict growth: The highest-paid role (CRNA) in 2012 grew fastest, the second-highest (NP) grew slowest, and the lowest-paid (LPN) finished second. Where a role started tells you nothing about how fast it climbed.
- This window truncates the 2 longest records: RNs and LPNs both grew about 148% since 1997, but only 49% and 55% show up here, because 2012 to 2025 is the only stretch with data for all 5 roles.
- The nursing field moved up together: In terms of salary growth, no role was left behind, and none broke away. Only 13 points separate the fastest role from the slowest, and every one of the 5 gained roughly half again over the period.
What the nursing salary history tells us
Before looking forward, two patterns in the data are worth naming, because both shape what the numbers actually mean for a nurse deciding where to go next.
A large percentage on a small base is still a modest raise
The fastest-growing role and the role that gained the most money are not the same role.
Percentage growth and dollar growth rank the roles differently.
- LPNs gained 55% across the 13-year window, second only to CRNAs, but that added just $22,860 to the median.
- CRNAs gained 60% and added $88,430, nearly 4 times as much, because they started from $148,160 rather than $41,540.
Entry-level pay in the largest nursing roles rose faster than top-end pay
For LPNs, RNs, and NPs, the pay ratio narrowed, meaning the floor climbed faster than the ceiling.
Only the 2 smallest occupations moved the other way, with CNMs seeing the top of the scale pull ahead and CRNAs showing the widest spread of any role in the report. For most nurses, that is the more relevant finding: the gains were not concentrated among the highest earners.
What comes next for nurse pay?
History offers a useful caution on what comes next.
The post-COVID stretch from 2019 to 2025 stands out across the board. RN pay rose 33% in those six years, LPN pay 36%, NP pay 20%, CNM pay 27.6%, and CRNA pay 35%. Reviewing nursing pay over time makes one thing clear: the last half-decade did most of the heavy lifting.
The open question is whether this post-pandemic acceleration holds or cools.
The plateaus seen in LPN and RN salary history show that nurse pay does not rise at the same rate every year, and a stretch of rapid gains can flatten without much warning. The safer read is that salary growth may stay positive even if the slope eases, since the forces pushing demand for nurses show no sign of reversing.
Those forces are largely on the supply side. The looming retirement of a significant portion of the nursing workforce, combined with a shortage of faculty to educate and train the next generation, leaves administrators competing for a pool of nurses that is not growing fast enough to meet demand. That pressure likely contributed to wage growth after 2020, and none of it has resolved.
Whatever the next few years bring, the long arc of nursing salary history points one way. Nurses in every role earn substantially more today than at any earlier point on record, and in most roles the floor rose faster than the ceiling. For anyone weighing a first nursing role or a move into advanced practice, that is a reasonable basis for optimism.
Interested in nursing school data? Our report pieces together data for a cohesive look at program demand, capacity, and job trends.
Sources:
- BLS - Occupational Employment and Wage Statistics
- BLS - Occupational Employment and Wages News Release
- Occupational Employment and Wage Statistics (OEWS) Tables
- Implementing the 2010 Standard Occupational Classification in the Occupational Employment Statistics: Monthly Labor Review
- Occupational Employment and Wage Statistics (OEWS) Maps
- Occupational Employment and Wage Statistics (OEWS) Profiles
- Databases, Tables & Calculators by Subject: U.S. Bureau of Labor Statistics

