


On paper, the average registered nurse in San Jose, California, makes $194,950 per year, whereas the average RN in Hammond, Louisiana, makes $81,910.
The nominal figures omit where the money is spent: the cost of living in San Jose is among the highest in the country, and prices in Hammond are among the lowest.
After adjusting for the cost of living, the average RN salary in San Jose is worth $176,550, and the average in Hammond is worth $96,980. The gap between the 2 cities ($113,040 on paper) shrinks to $79,570.
Depending on the city, local prices change what an RN’s salary is worth by 5% or more in 2 out of 3 cities and by 10% or more in 1 in 3, which is why a nominal salary says little on its own.
This report adjusts average RN pay in 374 U.S. cities and 133 rural areas for local prices and rent, using Bureau of Labor Statistics wages and Bureau of Economic Analysis regional price parities, then applies the same adjustment to entry-level pay and to per diem rates from the Nursa marketplace.
It goes a level deeper than state averages, to the cities where nurses actually sign leases, to find where an RN salary goes the furthest.
Key findings
- San Jose is still the top RN market after prices: Adjusted pay is $176,550 against the nominal $194,950. California holds the top 22 cities after adjustment, not just the Bay Area.
- Prices reverse nearly 1 in 5 city comparisons: Of the 69,751 possible pairs of cities, 18% change order once local prices are applied, and 53 cities move 100 or more places in the ranking.
- Miami–Fort Lauderdale is the biggest loser: The metro ranks 119th on nominal pay, 368th of 374 after adjustment. Four of the 10 biggest drops are Florida cities.
- The bottom of the map is Alabama: Daphne–Fairhope, Huntsville, and Decatur all land near $80,800 adjusted, the lowest real RN pay in the country.
- Rural California out-earns almost every city: Three nonmetro regions clear $135,000 adjusted, more than 364 of the 374 cities.
- Vallejo and San Jose offer the best first paycheck: A 10th-percentile RN wage there is worth more than $112,000 after prices. Salem and Medford, Oregon, lead outside California at about $97,000.
- Charlotte, NC, Billings, MT, and Cleveland, OH lead Nursa’s per diem RN rates after prices: Their adjusted midpoints are $64–$67 an hour in real terms, and Charlotte and Billings also post 2 of the 3 highest nominal rates of any market.
How the cost-of-living adjustment works
This report works at the city level because the cost of living can vary as much within a state as between states.
State price levels run from 86.9 in Arkansas to 110.7 in California; city price levels run from 83.6 in Monroe, Louisiana, to 115.6 in San Francisco, and most of that spread sits inside state lines. Miami (114.2) and Jacksonville (99.5) share a Florida average and nothing else, and the $5,680 nominal pay gap between them reverses once prices are counted.
The price level used throughout is the regional price parity (RPP), the Bureau of Economic Analysis's measure of what a fixed basket of goods, services, and housing costs in one place relative to a national average of 100.
Adjusted pay is a single division:
adjusted pay = nominal pay ÷ RPP × 100
A $100,000 salary in a city with an RPP of 110 is worth $90,909 in national dollars; the same salary in a city with an RPP of 90 is worth $111,111. Every adjusted figure in the tables below is this calculation applied to a BLS wage and a BEA index.
Note: Every "city" in this report is a metropolitan statistical area as defined by the federal government and used by both BLS and BEA, so "Dallas" means Dallas–Fort Worth–Arlington and "Los Angeles" includes Long Beach and Anaheim.
The tables list each area by its principal city and state.
Highest-paying cities for RNs adjusted for cost of living
Ranking cities on adjusted pay answers a different question from ranking them on salary: not where registered nurses are paid the most, but where their pay buys the most, which is what makes a city one of the best cities for nurses.
The 2 rankings agree at the top because California’s wage premium is larger than its price premium: San Jose pays 2.5 times what Daphne, Alabama, pays, but its price index is only 17% higher. They diverge in the middle and at the bottom, where a city’s rent can erase a wage advantage of $20,000 or more.
For RNs, the adjusted ranking is the one that tracks standard of living, which is why the same salary can be a top-quartile offer in one metro and a bottom-quartile one in another.
California sweeps the top of the adjusted list, and the sweep is wider than the Bay Area. The top 22 cities are all in California, and the inland cities hold their own against the coast: Sacramento ranks fourth at $153,930, ahead of San Francisco; Stockton, Modesto, and Yuba City all clear $138,000 adjusted while posting price indexes about 5 points above the national average. Vallejo, with a price index 7 points below San Francisco's and nominal pay $5,920 higher, finishes second, about $8,000 behind a San Jose salary in real terms.
Table 1: Top 25 cities for RN pay after cost of living, annual and per hour
The other end of the table belongs to Alabama and Florida, for opposite reasons. Alabama's cheap cities cannot make up for the lowest nominal RN pay in the country: Dothan's price index of 83.8, one of the lowest anywhere, still leaves adjusted pay at $84,140. Florida's nominal pay is middling, but price levels run from 92 in Sebring to 114 in Miami, so 13 of the state's 22 metros land in the bottom 50.
Table 1 (continued): Bottom 25 cities for RN pay after cost of living
Hidden-value cities: Where pay climbs the most after adjustment
These are the highest-paying cities for nurses with a low cost of living: small Southern and Appalachian metros with price indexes in the mid-80s, where a salary in the low-to-mid $80,000s buys close to what $100,000 buys nationally. Shreveport is the only climber with more than 6,000 RNs, and Brownsville is the only Texas entry.
Table 2: The 10 biggest rank climbs after cost of living
Hidden-cost cities: Where pay falls the most after adjustment
The biggest drops are coastal, resort, and commuter-belt markets where pay is ordinary, and rent is not: 4 Florida cities; Poughkeepsie–Newburgh, Manchester–Nashua, and Kenosha in the New York, Boston, and Chicago commuter belts; and the coastal cities of Portland, Maine, and Charleston, South Carolina.
Table 3: The 10 biggest rank drops after cost of living
The swings in Tables 2 and 3 have a single cause: rent.
Everything other than housing varies little from city to city, so a city’s price index is set largely by local rents.
- The climbers are cities where RN pay sits near the national level, but rent sits far below it, a pattern that runs across the South and Appalachia.
- The fallers are coastal, resort, and commuter-belt markets where rent is far above the national average and pay is not, so the nominal premium that draws nurses to Miami or Charleston does not cover the cost of living once they arrive.
The result is a mismatch between where RN pay looks competitive and where it is: a nurse recruited to a hidden-cost city on a nominal raise can end up with less purchasing power than before the move.
Adjusted RN pay in the largest nursing markets
The 66 metros that employ 10,000 or more RNs hold about 61% of the country’s 3.38 million RN jobs, so this is the comparison that applies to most of the workforce, and it is where the adjustment reorders the rankings readers are most likely to know.
Among these 66 cities, adjusted pay runs from $176,550 in San Jose to $83,210 in Miami, a spread of more than 2 to 1. The 7 California markets and Portland form the top tier, with nothing else above $118,000. Below them, the mid-size cities beat the coastal giants: Ann Arbor out-earns New York; Madison, Buffalo, and Albuquerque all out-earn Washington, Chicago, and Denver in real terms. Washington, which pays $104,590, lands 191st nationally once its 108.9 price index is applied, and Chicago drops from 93rd to 234th.
Rural nurse salary after cost of living
Rural areas are included because the nursing shortage is projected to be most acute there.
The Health Resources and Services Administration (HRSA) expects a 14% RN shortfall in non-metro areas by 2036, against 8% in metro areas. Pay is the usual explanation, and the nominal data supports it, whereas the adjusted data does not:
- Nominal data: The typical rural area pays $85,250 against $89,645 in the typical city, and 94 of the 133 rural areas pay below the city median.
- Cost-of-living-adjusted data: The typical rural price index is 87.8, compared with 93.5 for cities, which closes the gap almost exactly, and Western rural areas pay close to metro wages while costing close to the national average. Once prices are counted, the rural pay penalty largely disappears, and what remains is everything else that makes rural posts hard to fill, which pay data cannot measure, from commute times to whether the area is a healthy place to live.
Rural California and central Oregon beat most U.S. cities in real terms. The 3 nonmetro regions of California each clear $135,000 adjusted, which would rank them 10th through 12th if they were cities, ahead of San Diego, Los Angeles, and every market outside California. Central Oregon's $123,020 beats Bend, the metro next door, and rural Arizona turns a $96,490 salary into $118,160 on a price index of 81.7.
After adjustment, the rural median of $95,653 sits within $600 of the adjusted city median of $96,201, and 61 of the 133 rural areas out-earn the typical city.
Table 4: Top 15 rural areas for RN pay after cost of living
Cities that pay nurses the most after housing
Rent gets its own section because it is the part of the cost of living that varies most and the part RNs feel first. Across the 374 cities, the goods index runs only from 94 to 112 and the index for services other than housing from 91 to 109, while the rent index runs from 42 in Johnstown, Pennsylvania, to 212 in San Jose.
Cities with high rent have high overall price levels, and cities with low rent have low overall price levels (correlation: 0.94). In practice, a city's price index is a rent index with a small adjustment for everything else, so rent alone predicts most of what the full adjustment shows.
Measuring rent in hours of work at the local RN wage turns that index into something concrete: how much of a shift goes to the landlord. In the cheapest large markets, a month's rent costs about 2 shifts of 12 hours, whereas in the most expensive markets, it costs close to 4 or more.
The cities where rent costs the most hours are not the highest-rent cities but the ones where rent is high and pay is ordinary, which is why Miami (51 hours) and Denver (45) rank worse than San Francisco (34).
The chart below plots the rent index against adjusted pay for the 66 largest RN markets. Pay rises with rent, but far more slowly than rent itself: a market with rent 50% above the national average typically offers pay only about 17% above that of a market with average rent. San Jose, San Francisco, Sacramento, Fresno, and Riverside sit well above the line, and Los Angeles and San Diego sit close to it; Miami, Denver, Washington, and Orlando sit well below it.
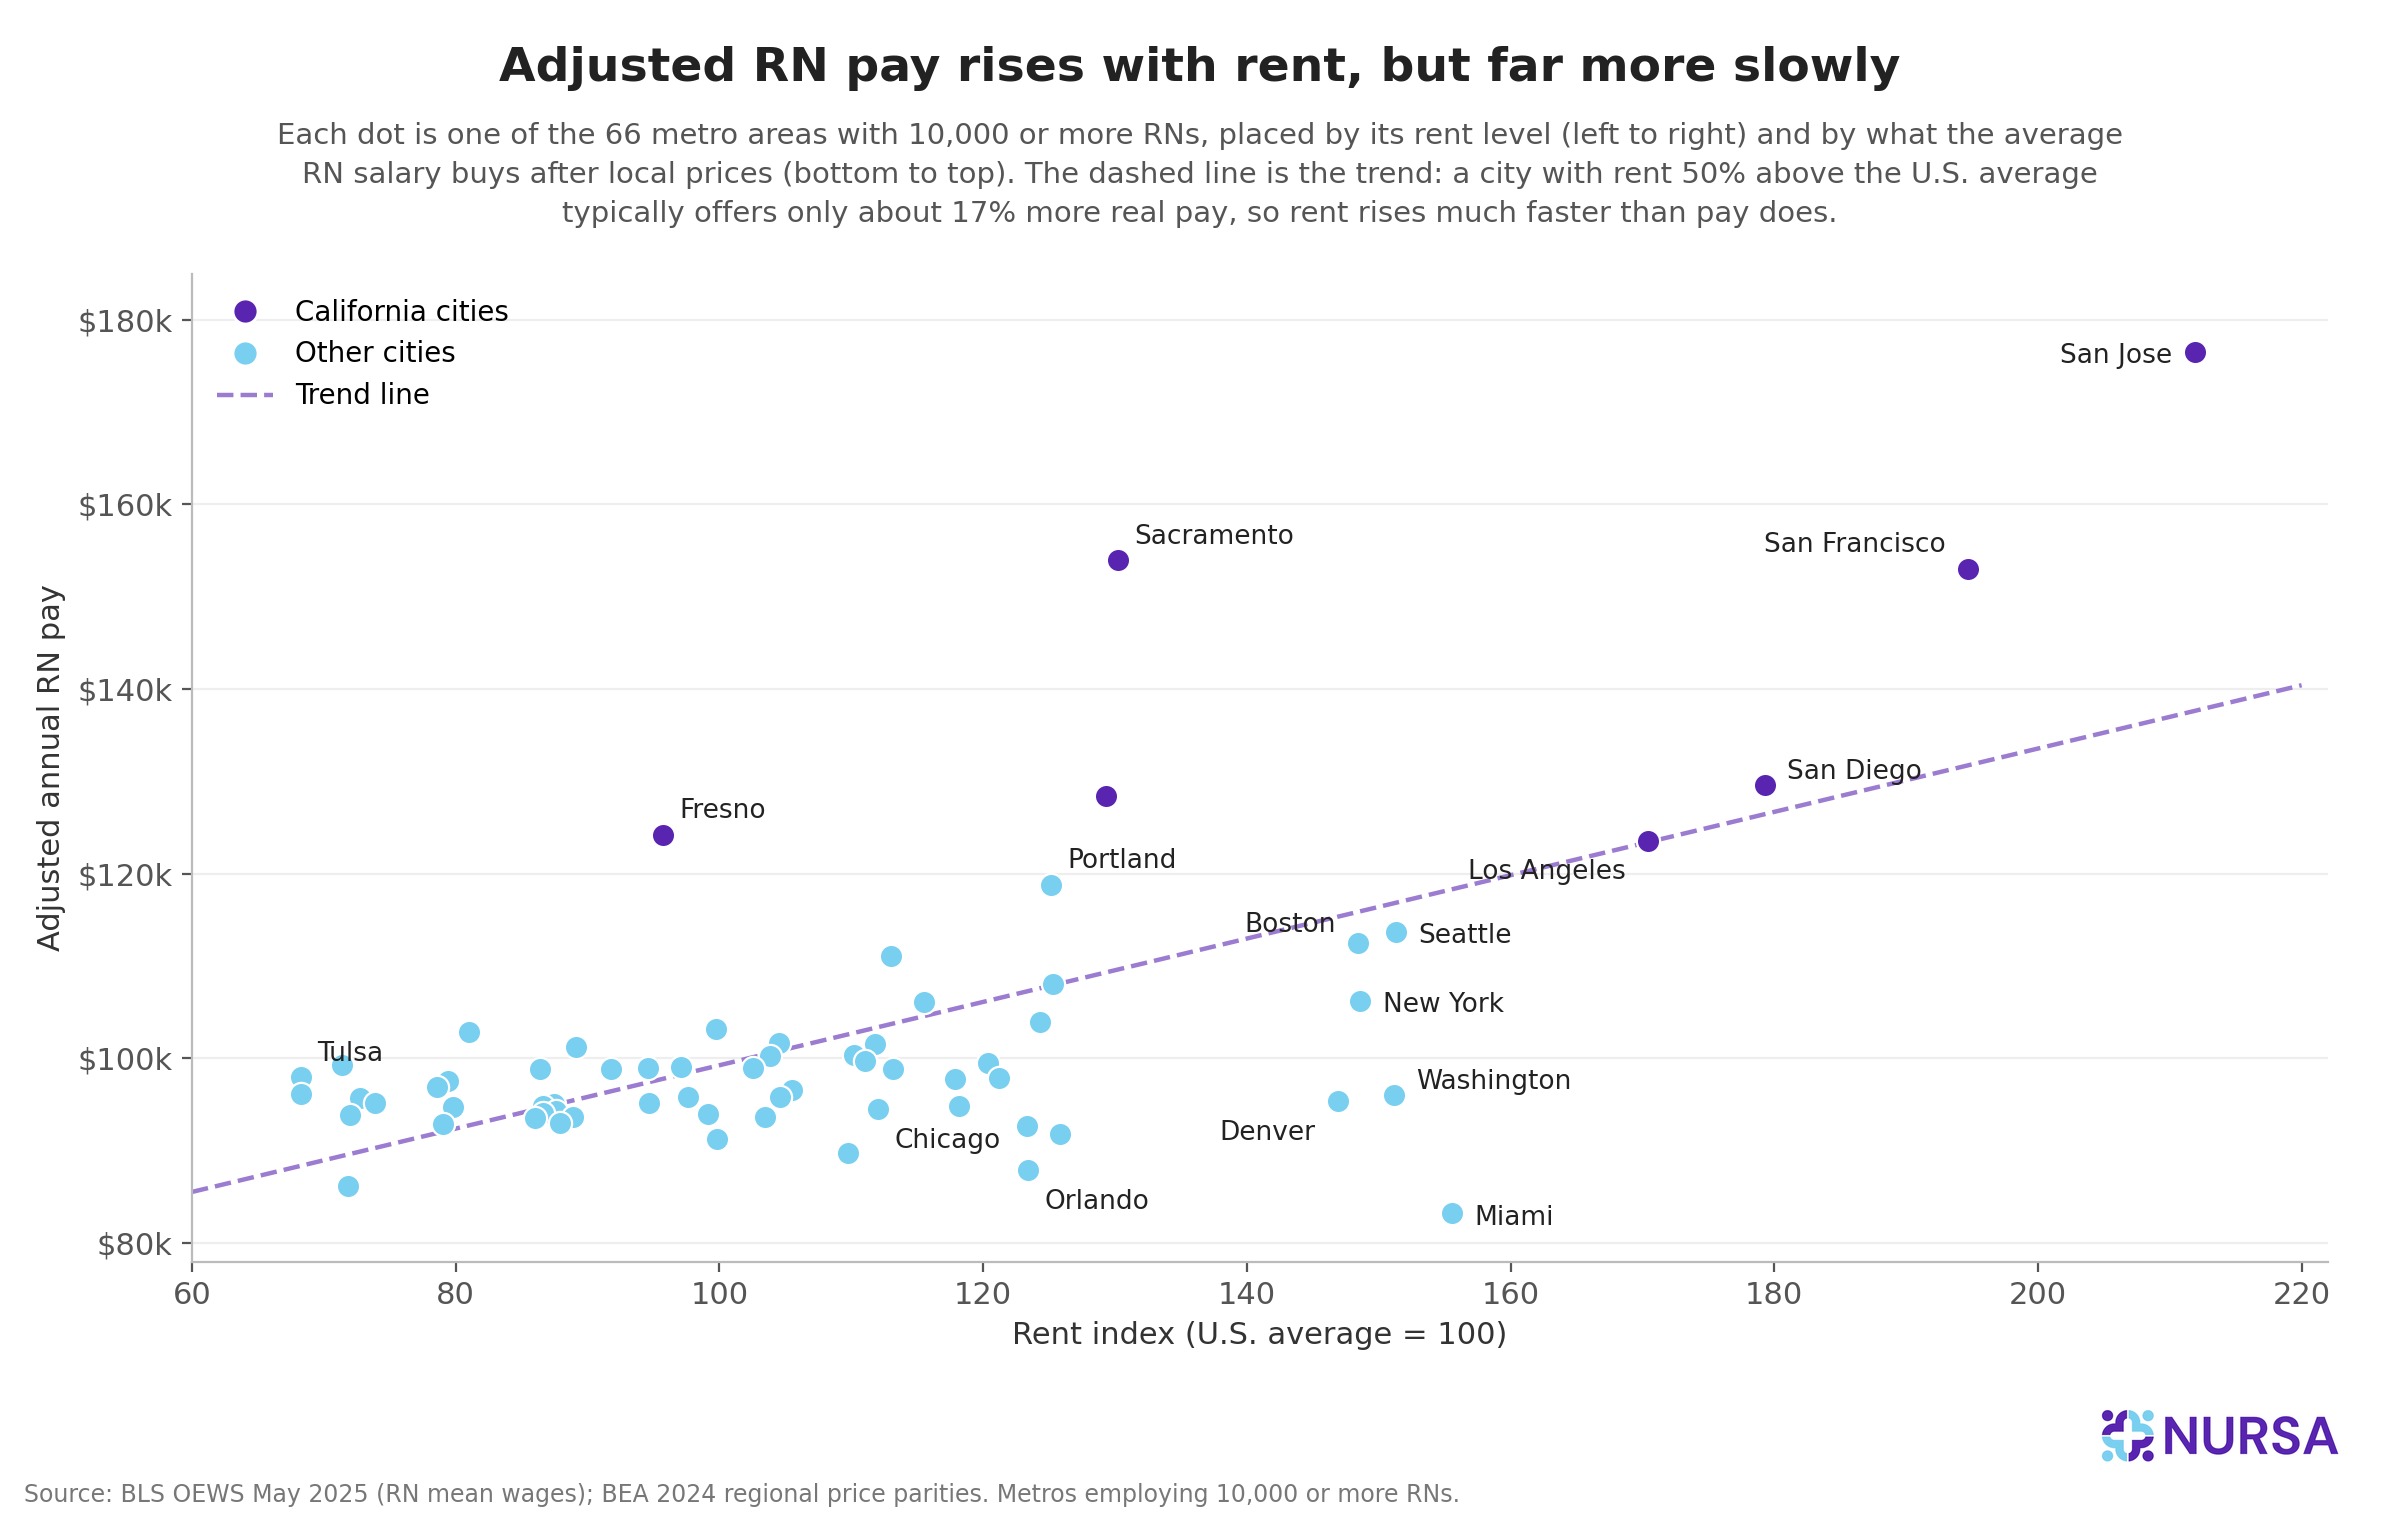
Table 5 measures nurse salary against rent in hours of work at each city’s average hourly RN wage, using the Census Bureau’s national median rent of $1,487 scaled by the local rent index. It covers the 66 largest RN markets and shows the 10 cities where nurses can most easily afford rent and the 10 where rent is most expensive per hour.
Table 5: The 10 markets where rent costs the fewest hours
Table 5 (continued): The 10 markets where rent costs the most hours
Sacramento and San Jose show why the hours metric matters more than the rent index alone. Both have rents far above the national average, but Sacramento's $78.94 hourly wage covers its rent in 25 hours, within an hour of Tulsa, and San Jose's $93.73 wage covers rent at 212% of the national level in 34 hours, fewer than Austin or Jacksonville.
Rent that absorbs a quarter of a paycheck can also add to financial stress, a factor in nurse burnout, which varies by state almost as widely as real pay does.
Entry-level RN salary by city, adjusted for cost of living
Starting pay is shown separately because it is the figure new graduates compare when deciding where to begin, and because they have the least cushion against the cost of living: no experience steps, little savings, and, often, student debt.
BLS does not publish pay by years of experience, so there is no official new grad nurse salary by city or by state. This section uses the 10th-percentile wage in each city as a proxy for a starting salary, the wage that 90% of RNs in that city earn more than. It is a floor set by the local market, not an ADN-versus-BSN figure, and the 25th percentile is shown alongside it as a check.
Nationally, the 10th-percentile RN wage is $68,940, and the typical city's is worth $74,030 after prices. The spread between cities at the floor is almost as wide as at the average: a 10th-percentile wage is worth $112,590 in Vallejo and $55,610 in Huntsville, a ratio of 2 to 1, against 2.2 to 1 for average pay. The cost-of-living effect reaches new nurses nearly in full.
The entry-level map looks like the overall map, with Oregon moving up: 18 of the top 25 cities are in California, and 5 are in Oregon, more than any state besides California. Two Minnesota college towns, St. Cloud and Mankato, round out the list on price indexes of 91 or lower. Texas does not appear in the top 25: Killeen–Temple is the state's best starting market at $82,440 adjusted (66th), followed by Lubbock and Odessa at about $76,500, and Houston at $75,900. Dallas–Fort Worth, where a 10th-percentile RN wage is $73,400 in nominal terms, drops to $71,200 after adjusting for its 103.1 price index.
Table 6: Top 25 cities for entry-level RN pay after cost of living
Table 6 (continued): Bottom 10 cities for entry-level RN pay after cost of living
A starting wage is a snapshot, and the floor is the part of the RN pay scale that has moved the most. The national 10th-percentile RN wage has climbed 141% since 1997, faster than the 90th percentile, so in nominal terms, the starting salaries in Table 6 sit at the highest level the profession has seen.
Per diem nurse pay by city, adjusted for cost of living
Per diem rates are adjusted separately because they are set differently. A staff salary reflects a facility's pay scale; a per diem rate reflects what facilities in a market are paying for a shift this week, so it moves with local demand rather than with the local cost of living.
Table 7 shows the cities where an hour of per diem work pays the most after cost of living. It takes the midpoint of the 25th-to-75th-percentile hourly rate for RN shifts booked through the Nursa marketplace in 2025 in each of the 49 markets Nursa reports and divides it by the city's price index, so the figures are what a PRN hour is worth in national dollars.
The cities where an hour of per diem work buys the most are mid-priced metros, not the high-cost coastal markets where staff pay is highest. Charlotte, Billings, and Cleveland lead at $64 to $67, and 9 of the top 10 markets have price indexes under 100; the coastal markets rank lower because their per diem rates do not carry the full premium that local rent would require. San Antonio is the top Texas market at $59.27, and Los Angeles is the top California market at $48.49. Rates move with demand for shifts, so the table is a snapshot rather than a quote. For RNs, this is the one part of the pay map where living in a cheaper metro does not mean earning less.
Table 7: Top 15 Nursa per diem RN markets after cost of living (hourly)
How cost of living adjustments change nursing pay
Adjusting for prices reverses a meaningful share of the comparisons that get made on nominal pay. Of the 69,751 possible pairs of cities in the dataset, 18% change order once prices are applied, and 53 cities move 100 or more places in the ranking.
A $95,000 RN salary in Miami and an $86,000 salary in Little Rock look $9,000 apart; after local prices, Little Rock is $12,900 ahead, and a month's rent there costs 25 hours of work, compared with Miami's 51. The same reversal happens inside a state: Chico pays $5,470 less than Los Angeles in nominal terms and $9,700 more in real terms.
Because job postings, recruiting campaigns, and most published salary rankings quote the nominal figure, the markets that look most generous on paper are often the ones where an RN's standard of living is lowest.
Per diem pay narrows the gap between cheap and expensive metros from the other side.
An hour of per diem work in Charlotte, Billings, or Cleveland is worth more after prices than the average staff RN hour in New York, Boston, or Seattle ($64–$67 against $51–$55), though staff roles usually include benefits that per diem work does not. For RNs in lower-cost metros, per diem work can match or beat staff pay in the most expensive cities without a move.
Frequently asked questions
Here are answers to common questions about RN pay and cost of living.
What is the highest-paying city for nurses after cost of living?
San Jose’s $194,950 average RN salary is worth $176,550 after local prices, about $8,000 ahead of Vallejo and $19,000 ahead of Santa Rosa. California holds the top 22 cities on the adjusted list; Bend, Oregon, is the best market outside the state. Table 1 has the full top and bottom 25.
Which cities pay nurses the most after rent?
Among the largest nursing markets, a month’s rent costs the fewest hours of RN work in Fresno (23), Winston-Salem and Tulsa (24 each), and Sacramento, Little Rock, Pittsburgh, Dayton, and Buffalo (25 each). It costs the most in Miami (51 hours), Denver (45 hours), and Washington (45 hours). Table 5 ranks the 10 best and worst.
Where does an entry-level RN salary go furthest?
An entry-level RN salary goes the furthest in Vallejo and San Jose, where the 10th-percentile RN wage exceeds $112,000 after adjusting for cost of living. Outside California, Salem and Medford, Oregon, lead at about $97,000 adjusted. The lowest real starting pay is in Huntsville, Alabama, at $55,610. Table 6 covers the top 25 and bottom 10.
Do nurses in California make more after the cost of living?
Yes, by a wide margin. All 24 California cities in the dataset rank among the top 26 after adjustment, and inland cities, such as Sacramento, Stockton, and Modesto, gain ground on the Bay Area because their rents are lower. Nursa’s RN salary page has the state-level comparison, and the salary hub covers licensed practical and vocational nurse (LPN/LVN) and certified nursing assistant (CNA) pay as well.
Which per diem markets pay nurses the most in real terms?
Charlotte leads Nursa markets at $67.18 an hour after cost of living, followed by Billings at $66.93 and Cleveland at $63.78, and Charlotte also has the highest nominal rate of the 49 markets. Table 7 lists the top 15.
Methodology
Wages are the mean annual and hourly RN wages from the Bureau of Labor Statistics' Occupational Employment and Wage Statistics for May 2025.
Price levels are the Bureau of Economic Analysis's 2024 regional price parities for each metro area and for the nonmetropolitan portion of each state.
The tables show the RPPs to 1 decimal, but the calculations use BEA's full-precision values, so hand calculations from the tables will differ slightly. BEA publishes a single index for the nonmetropolitan portion of each state, so every rural area in a state is adjusted with the same index, which flattens rent differences within a state. Tables list each metro by its principal city; Poughkeepsie, The Villages, Fort Walton Beach, and Sarasota stand in for Kiryas Joel–Poughkeepsie–Newburgh, Wildwood–The Villages, Crestview–Fort Walton Beach–Destin, and North Port–Bradenton–Sarasota.
Per diem rates are Nursa’s proprietary marketplace data: the 25th and 75th percentile hourly rates for RN shifts booked in 2025 in each of 49 markets. Markets are matched to BLS metropolitan areas by hand (Ft. Myers to Cape Coral–Fort Myers, New York City to New York–Newark–Jersey City); Augusta, Maine, has no metropolitan index and uses Maine’s nonmetropolitan index of 91.6.
Puerto Rico, the Virgin Islands, Delaware's nonmetropolitan area, and 8 metros without a published wage estimate are excluded, leaving 374 cities and 133 rural areas.
OEWS wages exclude overtime, shift differentials, and bonuses, and price parities do not account for taxes, amenities, or benefits.
Sources:
- May 2025 Metropolitan and Nonmetropolitan Area Occupational Employment and Wage Estimates
- Technical Notes for May 2025 OEWS Estimates
- Real Personal Consumption Expenditures by State and Real Personal Income by State, 2024
- Regional Price Parities by State and Metro Area
- Median Gross Rent, 2024 American Community Survey 1-Year Estimates (table B25064)
- HRSA: Workforce Projections

