


Labor is the largest expense for most healthcare facilities, and contract labor is the component that changed the most between FY 2019 and FY 2024.
Contract labor spending at hospitals and skilled nursing facilities (SNFs) nearly tripled from FY 2019 to a peak in FY 2022, then fell through FY 2023 and FY 2024. However, it has not fallen back down to where it started.
This report presents healthcare labor cost statistics for hospitals and SNFs from FY 2019 through FY 2024, based on our analysis of Centers for Medicare & Medicaid Services (CMS) cost reports. It examines spending trends and differences between the 2 care settings.
Key findings
Our analysis of CMS cost report data produced 6 findings:
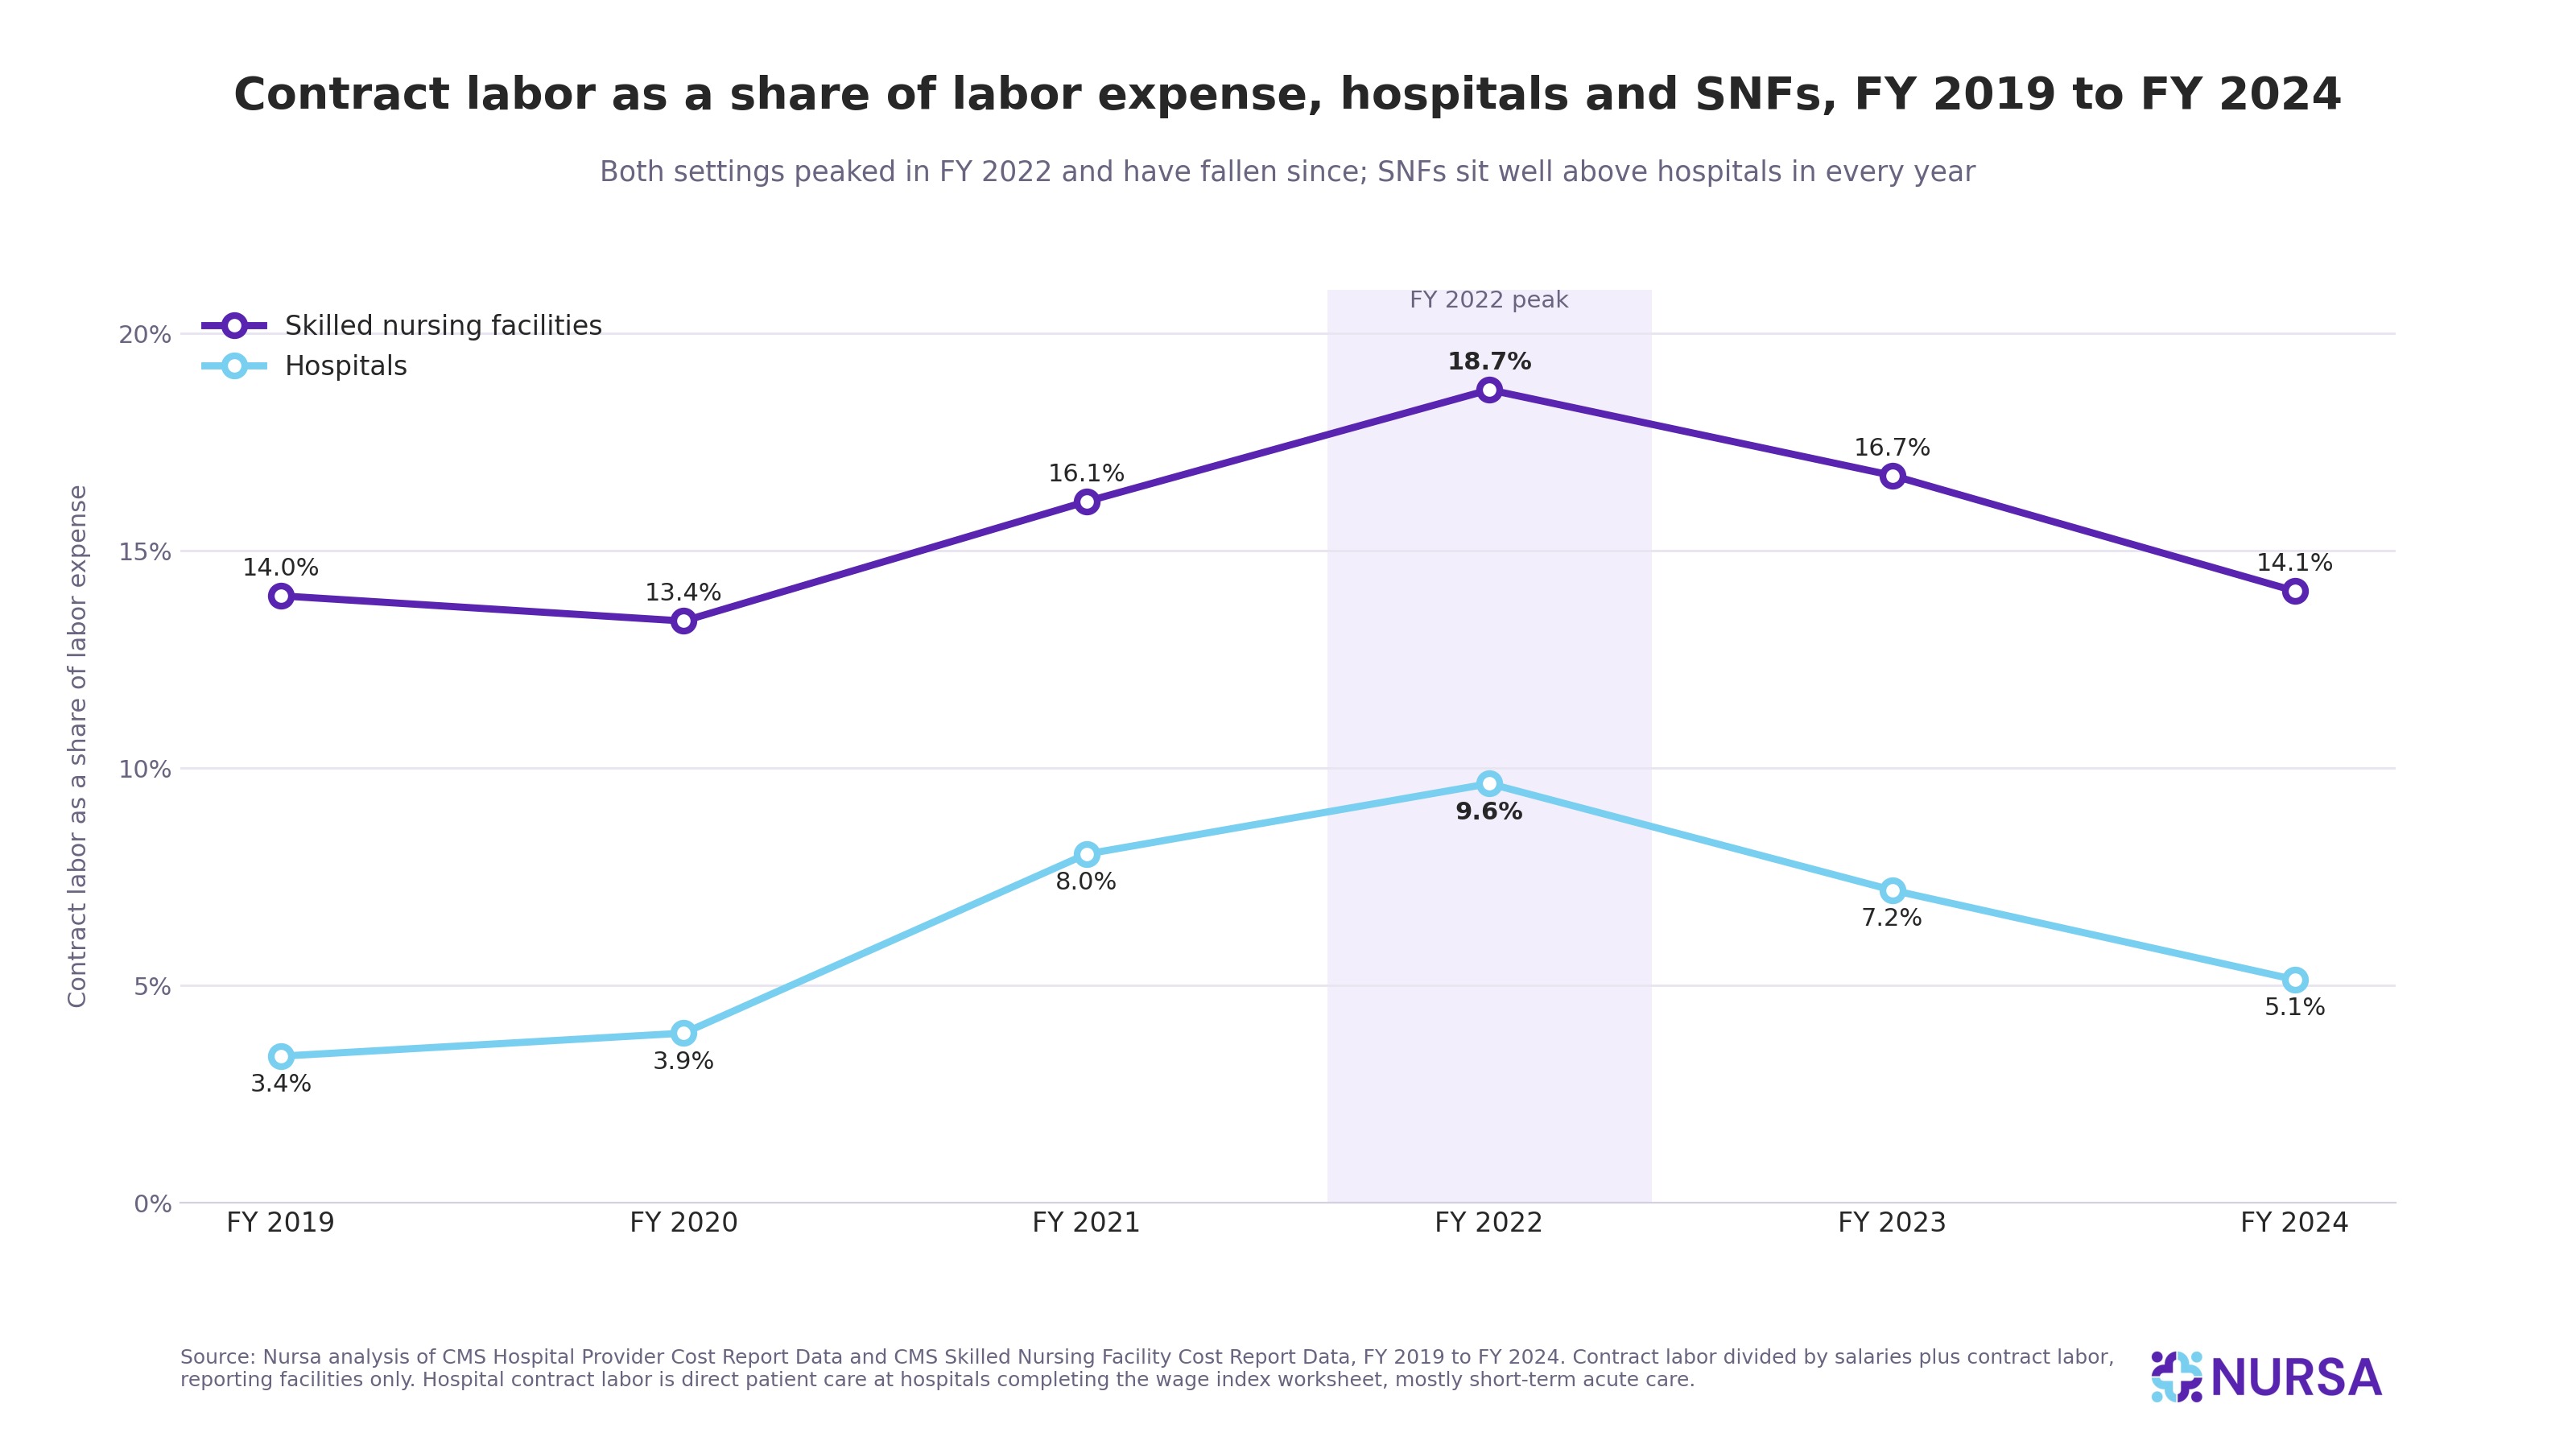
- Contract labor share of labor expenses: Hospitals went from 3.4% in FY 2019 to 9.6% in FY 2022, then back to 5.1% in FY 2024. SNFs went from 14.0% to 18.7% and back to 14.1%.
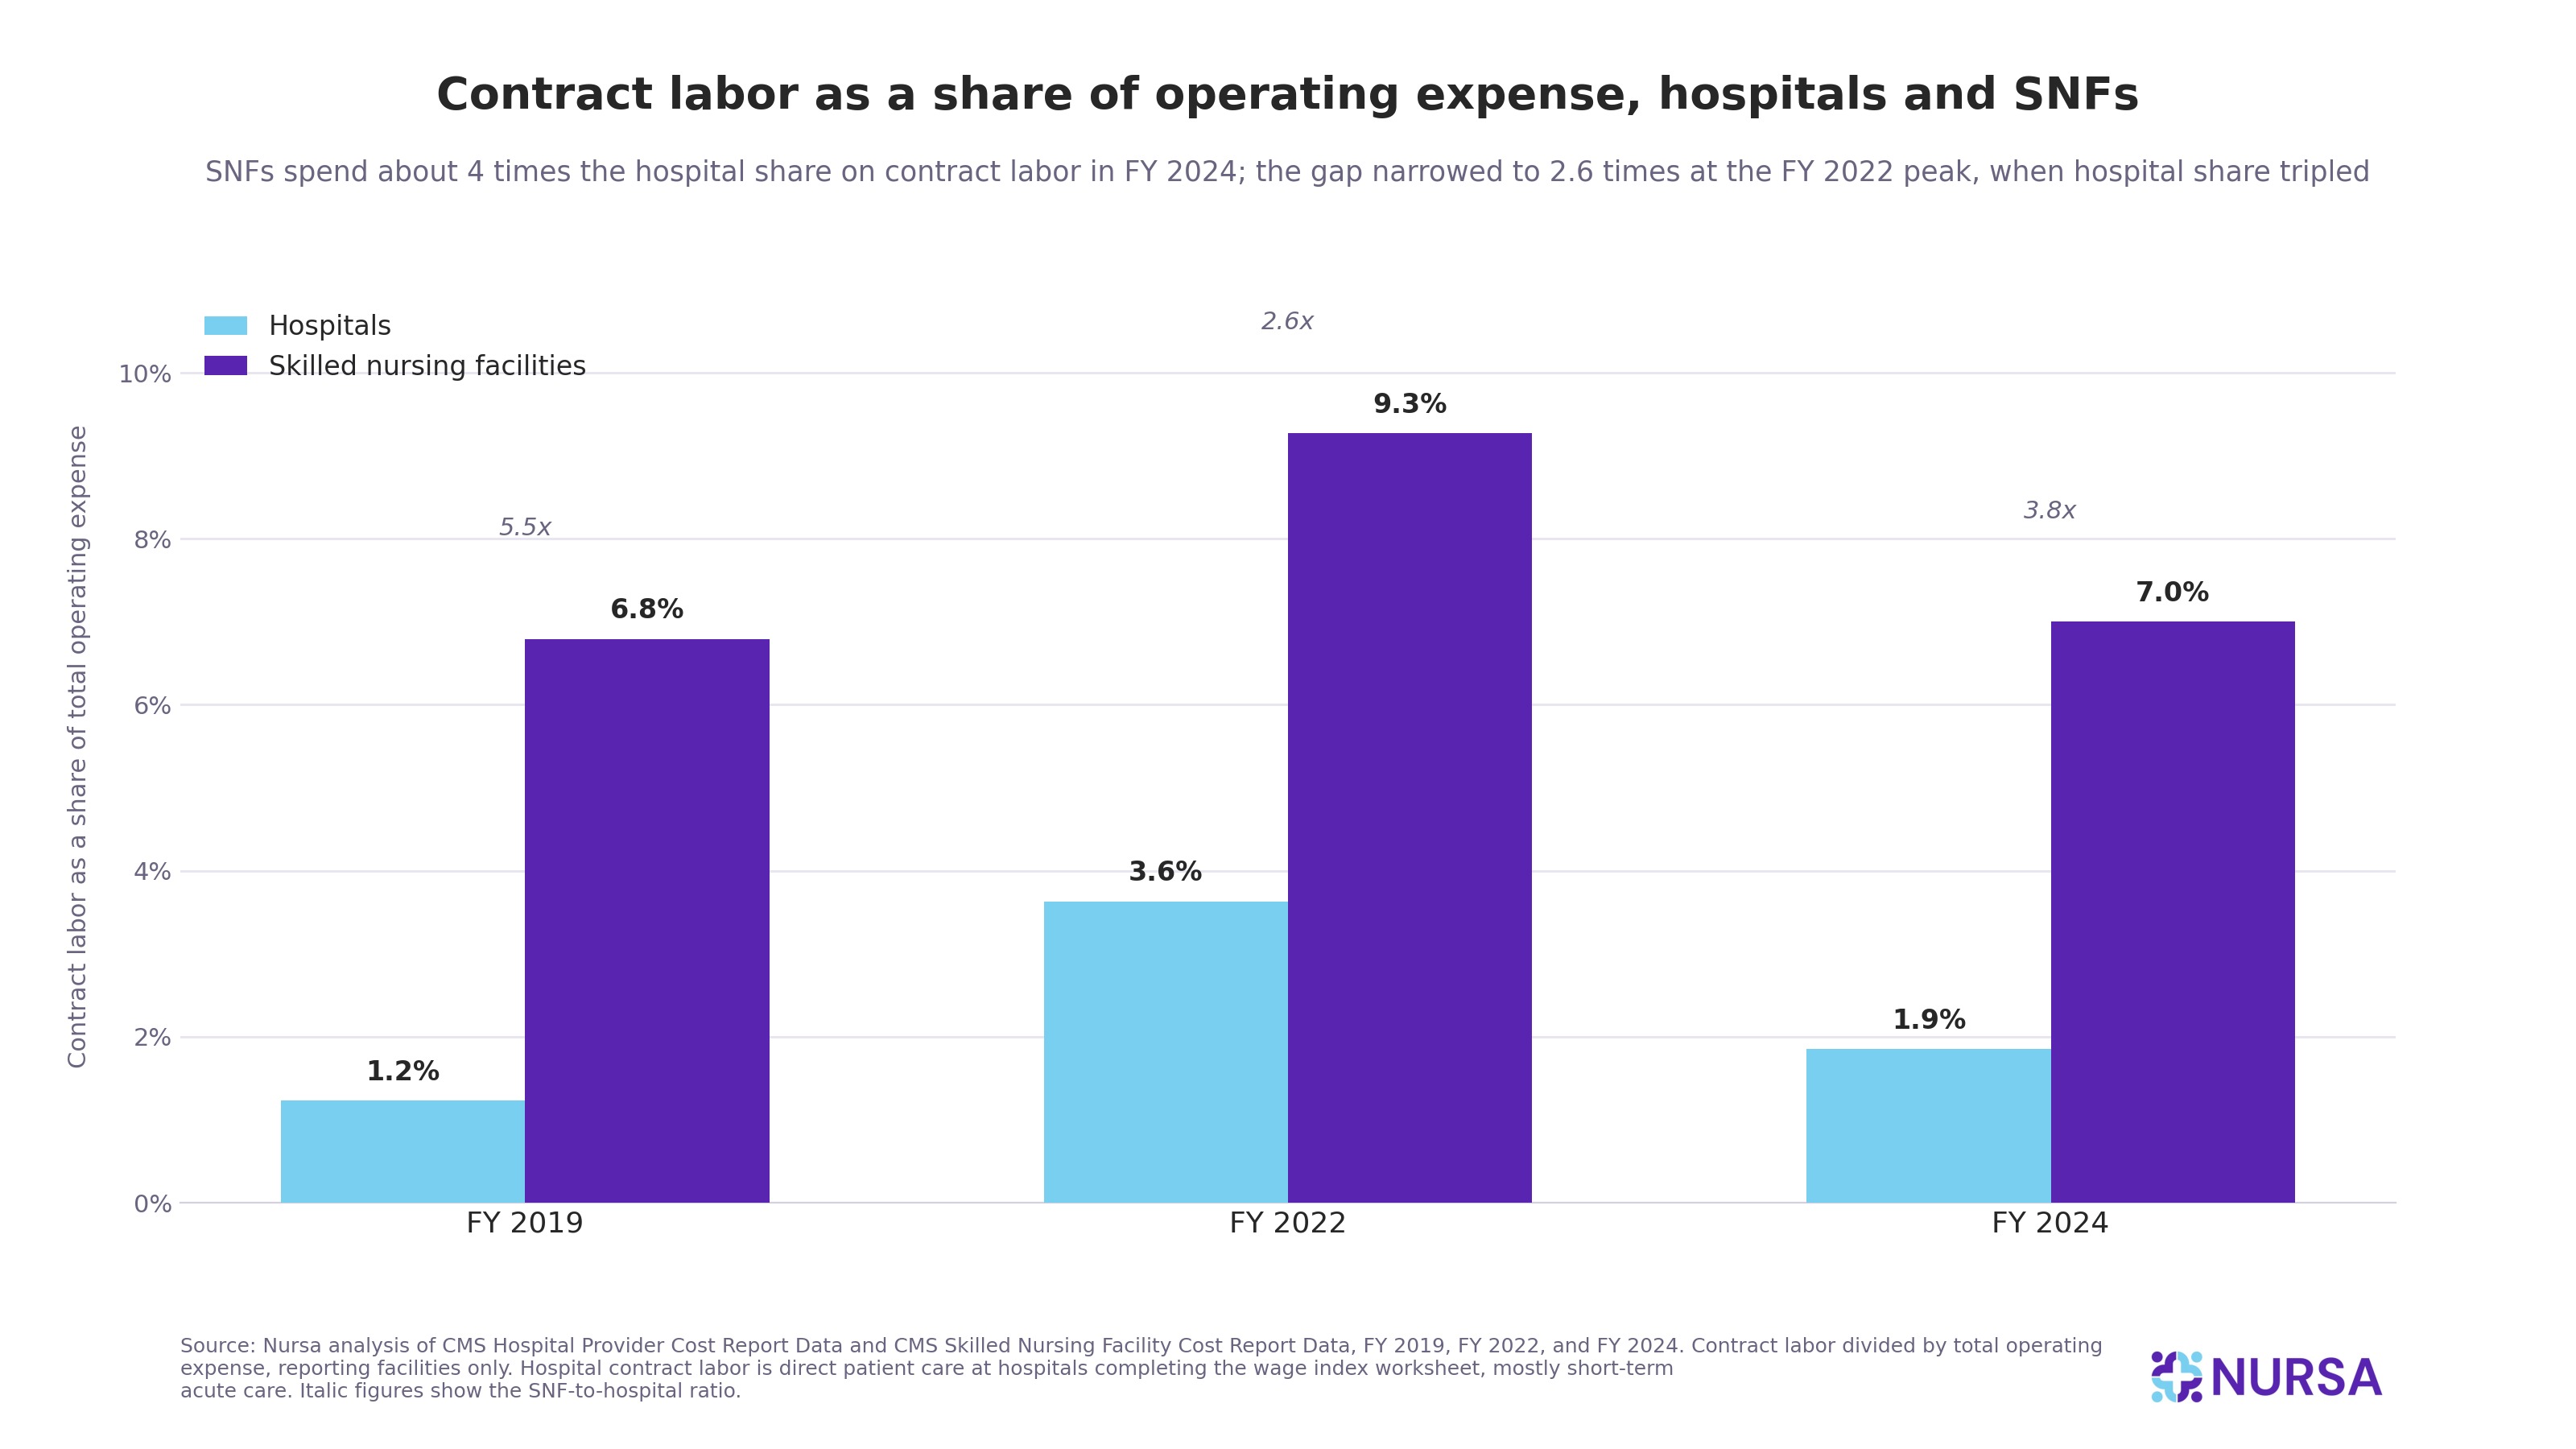
- SNFs lean on contract labor far more than hospitals: Contract labor was 7.0% of SNF operating expense in FY 2024 versus 1.9% for hospitals, about 3.8 times greater. The gap narrowed to 2.6 times at the FY 2022 peak, when hospital share tripled, and has widened again since.
- Dollars have not returned to FY 2019 levels: Reporting hospitals spent $23.96 billion on contract labor in FY 2024, against $10.84 billion in FY 2019. Reporting SNFs spent $9.46 billion, against $7.02 billion.
- Labor is roughly half of the expense: Salaries, benefits, and contract labor were about 44% of hospital operating expense and about 56% of SNF operating expense in FY 2024.
- Ownership and location matter more for SNFs: For-profit, government, and rural SNFs carried higher contract labor shares than nonprofit and urban SNFs. Hospital differences were small.
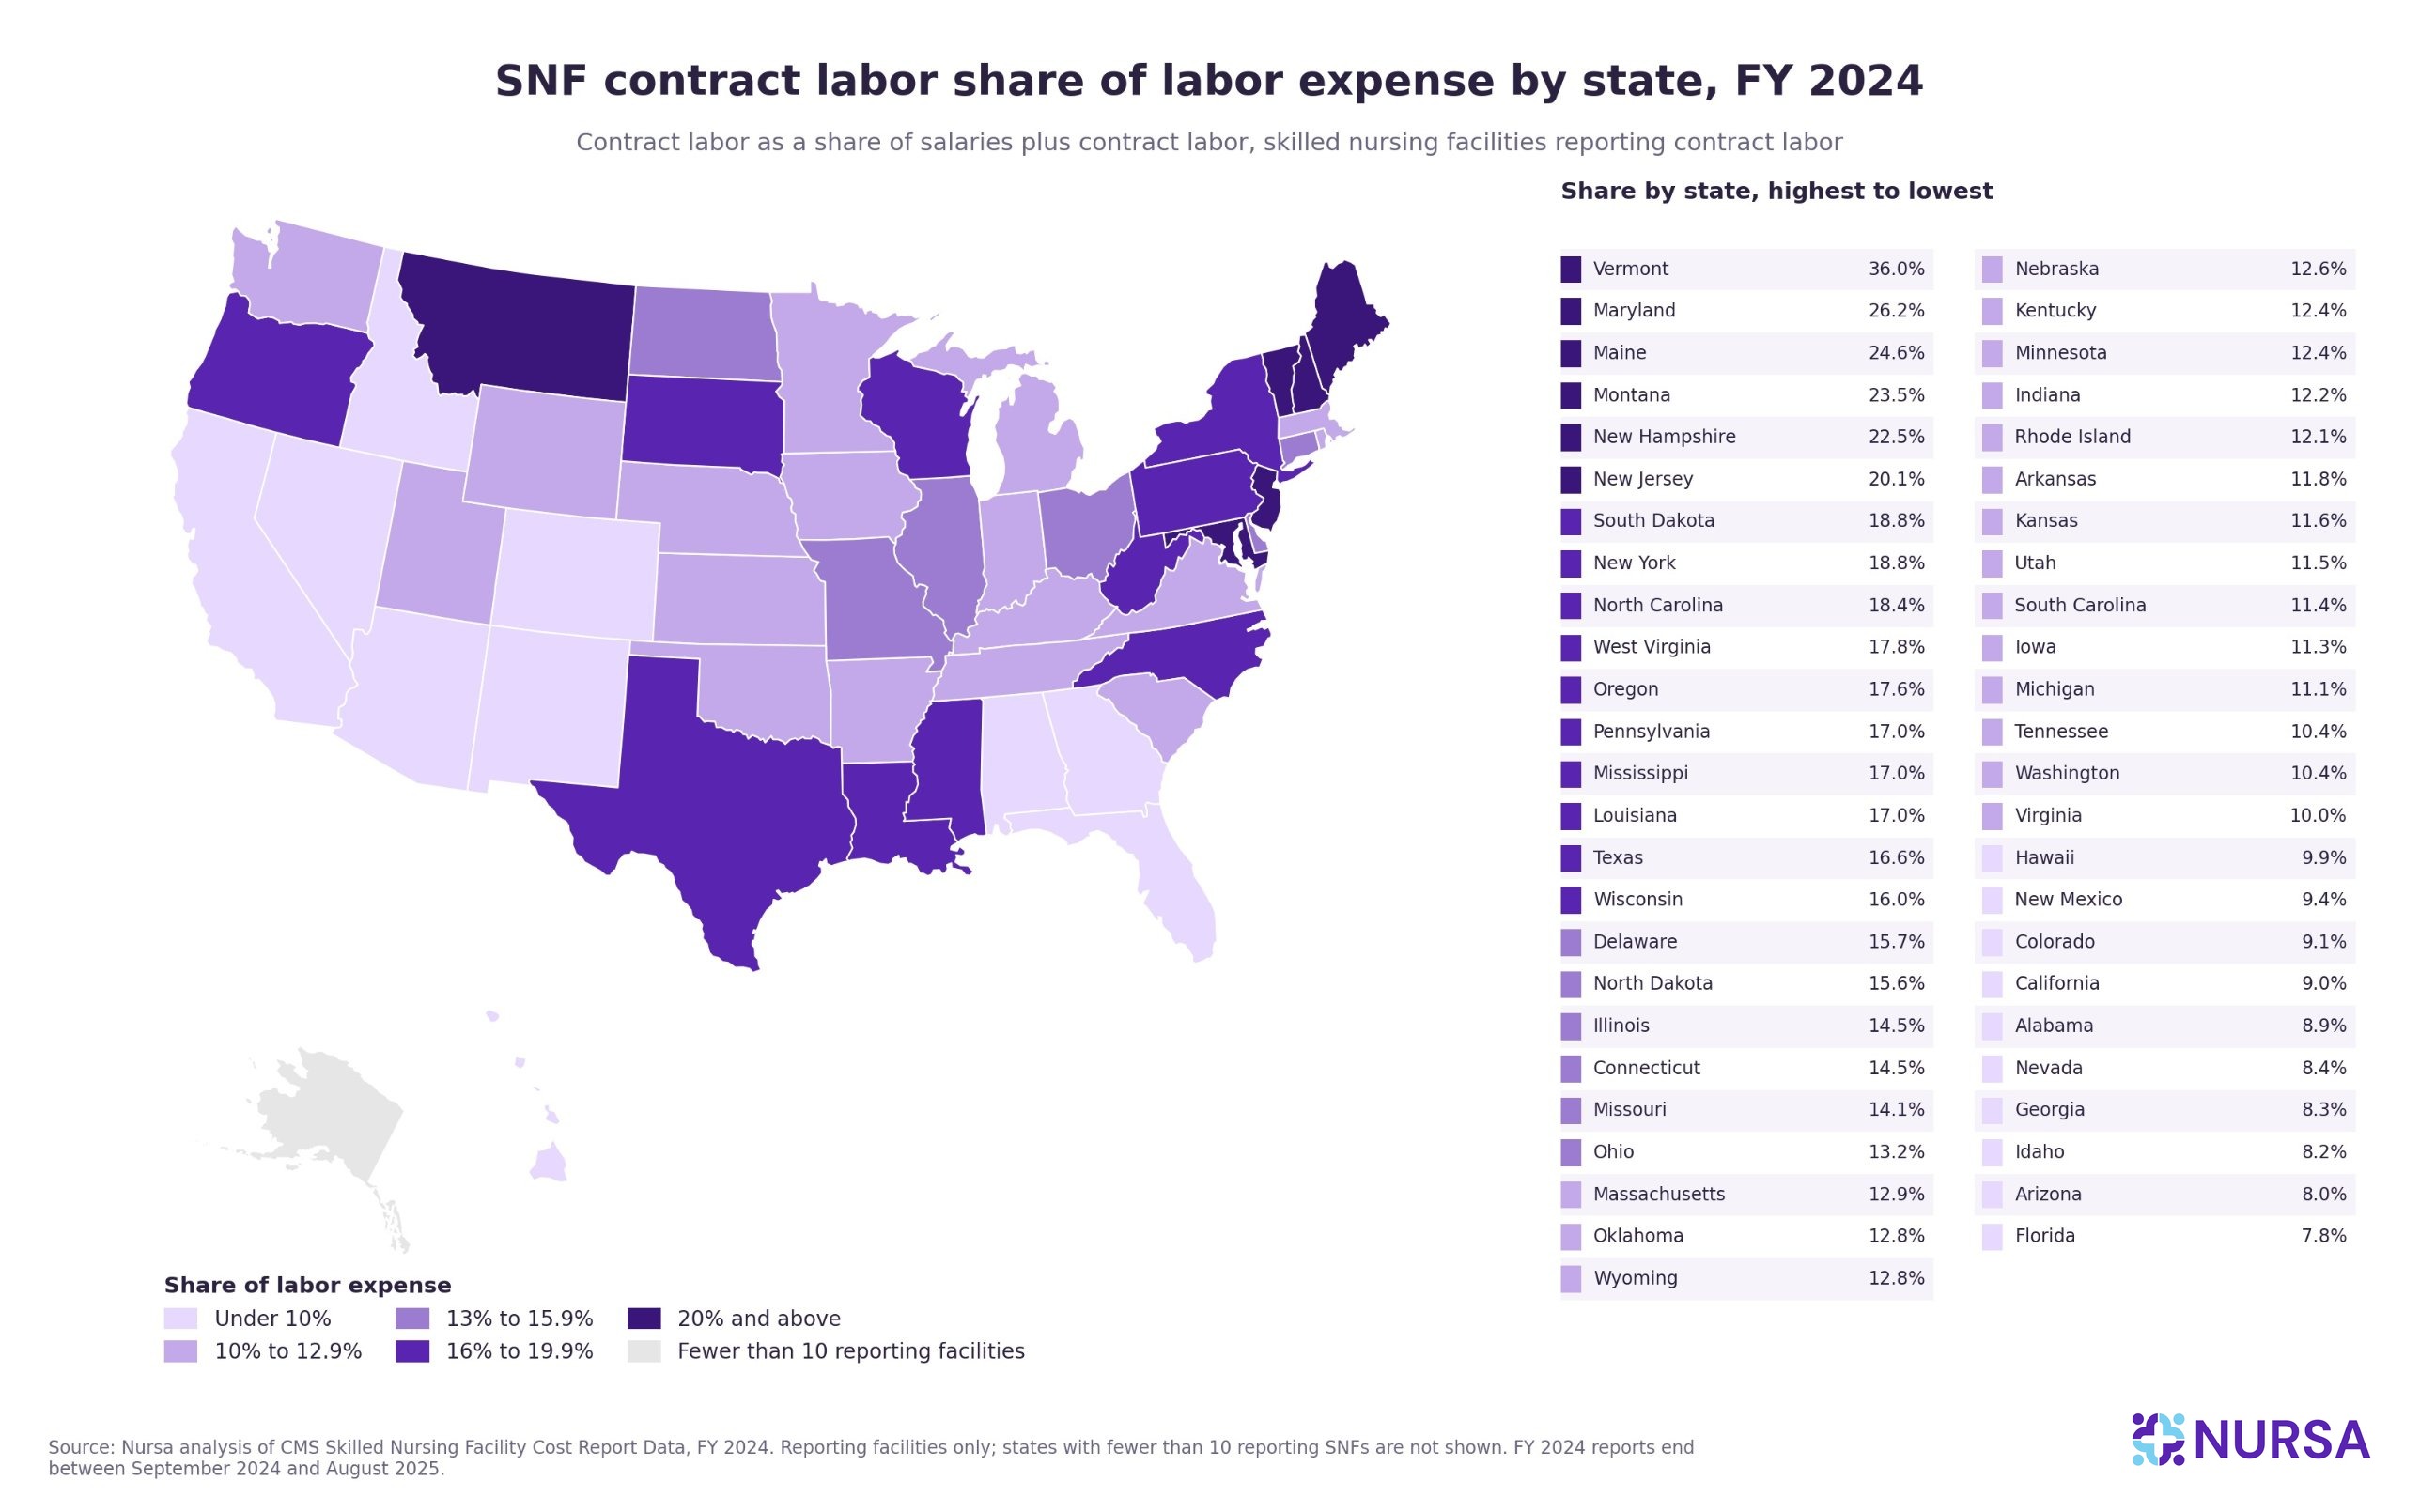
- State variation is the widest in the data: In FY 2024, SNF contract labor share ran from 7.8% in Florida to 36.0% in Vermont; hospitals ran from 1.2% in Utah to 9.9% in New Mexico.
Contract labor costs in hospitals get most of the attention; nursing home labor costs, where contract labor is a larger share of a smaller budget, deserve as much.
Methodology
A Medicare cost report is a financial filing that every Medicare-certified facility must submit each year. It records expenses, salaries, benefits, contract labor, revenue, and facility characteristics such as bed count, ownership, and location. We used 2 datasets published by CMS at data.cms.gov, FY 2019 through FY 2024, accessed October 2026:
- The Hospital Provider Cost Report Data
- The Skilled Nursing Facility Cost Report Data
Because this is the CMS cost report data that hospitals and SNFs file for Medicare payment, it covers facilities of all sizes and ownership types rather than a vendor sample. Additionally, a Medicare cost report records dollars rather than hours, so the contract labor figures in this report measure spending, not staffing.
Contract hours are reported separately through Payroll-Based Journal reporting and are outside the scope of this report.
Calculating the share of operating expense
Share of operating expense divides a labor item by the facility's total operating expense, the all-in cost of running the facility. Share of labor expense divides contract labor by salaries plus contract labor. Both are aggregates, meaning sums across facilities, so large facilities weigh more than small ones.
Fiscal years and cleaning
CMS assigns each cost report to a fiscal year based on when the reporting period begins, so the FY 2024 file includes reports ending anywhere from September 2024 to August 2025, most often on December 31, 2024. FY 2024 is not calendar 2024.
We kept 1 report per facility per fiscal year (the longest period, then the most recent filing) and dropped reports covering fewer than 300 or more than 400 days, which removed 4,452 filings and left 5,750 to 5,815 valid hospital reports and 13,102 to 13,821 valid SNF reports per year.
Who reports contract labor?
Hospitals report contract labor on the wage index worksheet, which only 2,863 to 3,023 hospitals complete each year (2,672 of the 2,922 FY 2024 reporters were short-term acute care), and the line covers direct patient care only.
Therefore, every hospital contract labor figure in this report describes reporting hospitals, mostly short-term acute care, and runs conservatively compared with industry surveys that define contract labor more broadly.
SNF contract labor is reported by 9,237 to 9,933 facilities per year, about 70% to 75% of valid reports. A blank value is treated as not reported, not as zero. Benefits come from the same worksheet, so the all-in labor share uses those filers while the salaries-only share uses all valid reports.
Data validation and cleaning
Because the set of reporting facilities changes each year slightly, we also tracked 2,221 hospitals and 6,976 SNFs present in FY 2019, FY 2022, and FY 2024. That group showed the same shape as the full sample (hospitals 3.4%, 9.5%, 4.8%; SNFs 14.2%, 19.5%, 14.6%), so the trend is not an artifact of who filed.
Table 1. What each source counts as labor and contract labor
How much of healthcare operating expense goes to labor?
In FY 2024, salaries, benefits, and contract labor together made up 43.9% of hospital operating expenses and 55.9% of SNF operating expenses. Salaries alone were 35.1% and 43.1%, and benefits sat near 8% in both settings.
How much do hospitals spend on labor? The clearest answer from public data is the following: a little under half of every operating dollar, with SNFs closer to 60 cents.
The 2 settings moved in different directions.
- Hospital labor costs as a percentage of expenses drifted down over the period, with salaries slipping from 36.5% of operating expense in FY 2019 to 35.1% in FY 2024 and the all-in figure from 45.2% to 43.9%.
- SNF salaries share rose from 41.9% to 43.1%, with the increase concentrated in FY 2023 and FY 2024.
Our hospital all-in figure is below the 60% that AHA's Costs of Caring 2026 report assigns to labor (about $1,009 billion in 2025, based on Strata Decision Technology benchmark data, including purchased services). The gap is definitional. AHA's labor line sweeps in outsourced services that cost reports book elsewhere; the cost report's operating expense includes items vendor samples leave out; and the hospital contract labor line captures direct patient care only.
Above, Table 1 lays out each source's definitions. The cost report version is the one that counts for policy. Medicare reimbursement rates are built from cost report expense data, so when CMS or MedPAC cite the labor share of hospital operating expenses, this is the figure they mean.
Table 2. Labor as a share of operating expense by component
Source: The data in the table comes from Nursa’s analysis of CMS Hospital Provider Cost Report Data and CMS Skilled Nursing Facility Cost Report Data, FY 2019 to FY 2024. Salaries share uses all valid reports; all-in share (salaries plus benefits plus contract labor) uses wage index filers. Benefits ran from 8.2% (FY 2019) to 7.7% (FY 2024) for hospitals and 8.3% to 7.5% for SNFs.
How is contract labor counted?
Cost reports count contract labor as payments to outside firms or individuals for staff who work at the facility but are not on its payroll. In nursing, that is mostly agency and travel staff. Cost reports record dollars only, so the figures in this report say nothing about headcount or hours.
That has a practical consequence. When contract labor dollars fall, a cost report cannot show whether facilities used fewer contract hours, paid lower rates, or both. The FY 2022 to FY 2024 decline fits either explanation. For SNFs, pairing these figures with contract hours from Payroll-Based Journal data would separate the two.
The hospital line covers direct patient care contract labor only. The SNF line is the facility's full contract labor entry. Both exclude purchased services that are not labor, such as outsourced laundry or billing. For a facility working out contract labor as a percentage of labor expense, the distinction between travel nurses vs. agency nurses does not change the math; both land on the same line.
What facilities pay for travel nurses and agency staff is what drives the agency nurse spending statistics below.
Contract labor share of expense, FY 2019 to FY 2024
Both settings followed the same arc, and it is the clearest of the healthcare labor cost trends that 2024 cost reports make visible.
- Contract labor share of labor expense climbed from FY 2020, peaked in FY 2022, and fell through FY 2023 and FY 2024.
- SNFs sat well above hospitals every year, and the hospital contract labor trends ran steeper on the way up and on the way down.
Table 3. Contract labor share, hospitals and SNFs, FY 2019 to FY 2024
Source: The data in the table comes from Nursa’s analysis of CMS Hospital Provider Cost Report Data and CMS Skilled Nursing Facility Cost Report Data, FY 2019 to FY 2024 (reporting facilities only). Hospital contract labor refers to direct patient care contract labor at hospitals completing the wage index worksheet. FY refers to the cost report fiscal year; FY 2024 reports end between September 2024 and August 2025. Shares are aggregates; medians sit lower when a few large facilities pull the aggregate up (hospitals: 7.9% median against 9.6% aggregate in FY 2022; SNFs: 11.5% against 14.1% in FY 2024).
Hospitals
Among hospitals that report contract labor, mostly short-term acute care, contract labor nearly tripled as a share of labor expense between FY 2019 and FY 2022 (3.4% to 9.6%) and gave back more than half of that gain by FY 2024 (5.1%). Hospitals ended the period at about 1.5 times their FY 2019 share.
One hospital type stands apart. Long-term care hospitals carried the highest share in every year, 12.4% in FY 2019, 15.5% in FY 2022, and 8.4% in FY 2024 across 81 reporters, while short-term acute care hospitals tracked the overall figure.
Skilled nursing facilities
SNF contract labor rose from 14.0% of labor expense in FY 2019 to 18.7% in FY 2022 and returned to 14.1% in FY 2024, a smaller swing than hospitals saw but from a far higher base. Skilled nursing facility labor costs are more exposed to contract rates than hospital labor costs for that reason.
On the surface, the FY 2024 share appears back at its FY 2019 level. The dollar figures in the next section show why that interpretation is incomplete.
Dollars have not returned to FY 2019 levels
The SNF share returned to 14% because SNF salary expense grew, not because contract labor spending fell back to FY 2019 levels. Reporting SNFs spent $9.46 billion on contract labor in FY 2024, 34.8% more than the $7.02 billion they spent in FY 2019, even after a 16.0% decline from the FY 2022 peak of $11.26 billion.
Hospitals show the same pattern at a larger scale: $10.84 billion in FY 2019, $40.00 billion at the FY 2022 peak (up 269.1%), and $23.96 billion in FY 2024, a 40.1% decline from the peak and still 121.1% above FY 2019.
Table 4. Contract labor spending at reporting facilities, FY 2019 to FY 2024
Source: The data in the table comes from Nursa’s analysis of CMS Hospital Provider Cost Report Data and CMS Skilled Nursing Facility Cost Report Data, FY 2019 to FY 2024 (reporting facilities only, not a national total). Reporter counts vary by year (hospitals 2,863 to 3,023; SNFs 9,237 to 9,933).
Consumer prices rose about 23% from December 2019 to December 2024. Over the same span, SNF contract labor spending rose 34.8, and hospital contract labor spending rose 121.1%. Inflation explains part of the higher baseline, and the rest reflects how much more facilities now spend on outside labor.
Contract labor share by ownership, location, and size
Contract labor share is not uniform within a setting.
- For SNFs, the differences by ownership, location, and size are large enough to change what a fair benchmark looks like; SNF share rises with bed count, from 10.8% at facilities with 1 to 25 beds to 16.0% at 201 to 400 beds in FY 2024.
- For hospitals, the differences are small enough that national figures are a reasonable starting point, with every bed-size band ranging from 4.4% to 5.8%.
Table 5. Contract labor share of labor expense by ownership and location, FY 2024 (FY 2022)
Source: The data in the table comes from Nursa’s analysis of CMS Hospital Provider Cost Report Data and CMS Skilled Nursing Facility Cost Report Data, FY 2022 and FY 2024. Ownership follows the cost report "Type of Control" field, collapsed to nonprofit (voluntary), for-profit (proprietary), and government. Rural and urban follow the cost report field.
Ownership
Nonprofit SNFs had a contract labor share of 11.8% in FY 2024, compared with 14.8% for for-profit and 15.0% for government SNFs. The nonprofit-to-for-profit gap also held at the FY 2022 peak (15.1% versus 20.3%).
Among hospitals, ownership made little difference: 4.3% to 5.3%, with nonprofits at the top.
Rural and urban facilities
Rural SNFs carried a 15.4% contract labor share in FY 2024 against 13.8% for urban SNFs, and were higher at the peak as well (20.1% versus 18.5%).
Hospitals showed no meaningful difference (5.2% rural, 5.1% urban). For nursing home operators, rural healthcare staffing strategies start from a higher contract labor baseline than the national figure suggests.
Contract labor share by state
The state is where the data varies most. In FY 2024, SNF contract labor share ran from 7.8% in Florida to 36.0% in Vermont, and hospital share from 1.2% in Utah to 9.9% in New Mexico. Those ranges dwarf every ownership, location, and size difference above. Among the 44 states and Puerto Rico with 10 or more reporting hospitals and the 49 states with 10 or more reporting SNFs, the FY 2024 figures sort as follows:
- Highest hospital shares: New Mexico (9.9%), Nebraska (8.6%), California (8.6%), Mississippi (7.9%), and New Hampshire (7.8%).
- Lowest hospital shares: Utah (1.2%), Florida (2.3%), Minnesota (2.7%), Texas (2.8%), and Michigan (3.0%).
- Highest SNF shares: Vermont (36.0%), Maryland (26.2%), Maine (24.6%), Montana (23.5%), and New Hampshire (22.5%).
- Lowest SNF shares: Florida (7.8%), Arizona (8.0%), Idaho (8.2%), Georgia (8.3%), and Nevada (8.4%).
- Largest declines from FY 2022: Maine SNFs from 35.6% to 24.6%, West Virginia SNFs from 30.7% to 17.8%, and New Mexico hospitals from 16.5% to 9.9%.
- The only increases: Maryland SNFs, from 25.1% to 26.2%, and Puerto Rico hospitals, from 6.4% to 7.1%.
- Barely moved while the national SNF figure fell 4.6 points: Texas SNFs, from 17.1% to 16.6%, the smallest decline of any state, and New Jersey, from 21.4% to 20.1%.
Across the contract-labor-by-state figures in healthcare, SNF shares run higher in the Northeast and northern states and lower in the Southeast and Mountain West. The cost reports describe that pattern; they do not explain it. For facilities in the states that barely moved, the post-2022 decline most of the country saw hasn’t shown up in their own cost structure yet.
Table 6a. Hospitals: contract labor share of labor expense by state or US territory, FY 2022 and FY 2024
Table 6b. Skilled nursing facilities: contract labor share of labor expense by state or US territory, FY 2022 and FY 2024
Source: The data in the table comes from Nursa’s analysis of CMS Hospital Provider Cost Report Data and CMS Skilled Nursing Facility Cost Report Data, FY 2022 and FY 2024. States and territories with fewer than 10 reporting facilities are omitted. Small-state figures (Vermont, 32 SNFs; New Hampshire, 12 hospitals) are sensitive to a few large facilities.
Labor cost, revenue, and margin
MedPAC’s March 2026 report puts the labor figures in a margin context.
For hospitals in FY 2024, MedPAC reports an all-payer operating margin of 6.5%, up 1.3 percentage points and near the 6.7% of 2019, an all-payer total margin of 7.9%, and a fee-for-service Medicare margin of negative 12.1%, projected to improve to about negative 10% in 2026. MedPAC attributes about half of the operating margin gain to one-time 340B remedy payments and much of the rest to slower labor cost growth, under 2% in FY 2024 after about 9% in FY 2023. Margins split sharply by ownership and location: 14.5% for for-profit hospitals versus 5.9% for nonprofit, and 6.6% for urban hospitals versus 1.5% for rural nonmicropolitan hospitals.
For freestanding SNFs, MedPAC reports a fee-for-service Medicare margin of 24% in 2024 (22% in 2023, projected at 25% in 2026), alongside an all-payer total margin of just 2.1% (up from 0.4%), with 40% of SNFs negative on that measure. We did not compute margins from the cost report files.
Our own figures show why labor share matters for margin, and the connection is arithmetic rather than causal. When labor is 44% of a hospital's operating expense and 56% of an SNF's (Table 2), the same change in wages or contract rates moves total cost further in the SNF. Healthcare workforce costs set how sensitive a margin is to the labor market, and that sensitivity is structurally higher in post-acute care.
A simple illustration shows the difference. Suppose contract labor spending rose 10% with everything else held constant. SNF operating expense would rise about 0.7%, enough to take roughly a third out of a 2.1% all-payer margin. At a hospital, the same increase would add about 0.2% to expense against a 7.9% margin.
What newer data shows for 2025 and 2026
FY 2024 is the latest complete cost report year. Three published sources carry the picture forward, each with its own sample and definitions (Table 1), so their figures sit alongside ours rather than on the same scale.
Only one of them, MedPAC, reports contract labor as a separate figure, and it does so from the same cost reports we used. The other two, AHA and Kaufman Hall, are more current but fold contract labor into a single labor line, so they can say where total labor cost is heading but not what share of it is contracted.
MedPAC’s March 2026 Report to the Congress adds a few signals from 2025. Large for-profit hospital systems cited lower contract labor costs among the reasons their margins improved in 2025, and SNF hourly wage growth, 2.8% in 2024, slowed to 2.6% in preliminary 2025 data.
Two analyses of the same cost reports, done separately, land in the same place: MedPAC estimates hospital contract labor fell about 25% from FY 2023 to FY 2024, and Nursa’s analysis puts the decline at 25.8%, from $32.27 billion to $23.96 billion (Table 4).
The AHA Costs of Caring 2026 report, which covers calendar 2025, puts workforce cost growth at 5.6% against 7.5% growth in total hospital expenses, so the dollar baseline our FY 2024 figures describe was still rising a year later. AHA’s labor line is 60% of hospital expenses, inclusive of purchased services.
Kaufman Hall’s National Hospital Flash Report for March 2026, drawn from more than 1,300 hospitals, shows labor expense per calendar day up 4% year over year but labor expense per adjusted discharge down 1%, with full-time equivalents per adjusted occupied bed down 8%. Total labor cost is still growing; the cost per unit of care is not.
Medicare rate updates are tied to measured cost growth, so the healthcare payment models that govern hospital and SNF revenue lag behind the labor costs facilities incur. When FY 2025 cost reports are complete, expect a further decline in contract labor share from FY 2024, with contract labor dollars still above the FY 2019 baseline.
What the numbers mean for financial and workforce planning
Labor is roughly half of the operating expense in both settings, contract labor is its most variable component, and FY 2024 contract labor dollars remain well above FY 2019. The healthcare labor expense benchmarks in this report are most useful when applied to a facility's own setting rather than the national average.
Benchmark against your setting and state, not the nation
A national figure can mislead. A rural for-profit SNF in a high-share state and an urban nonprofit hospital in a low-share state face different norms, and Tables 5 and 6 show how far apart they sit. The right comparison is the group a facility belongs to: facility type first, then state, then ownership, and then location. The healthcare staffing metrics that a finance team already tracks supply the internal numbers to set against those benchmarks.
Start with the median. Aggregate figures weight large facilities more heavily, and a few heavy users pull them up. In FY 2024, the median SNF’s contract labor share was 11.5%, against the 14.1% aggregate. An SNF comparing itself to the headline figure is measuring against a number set mostly by its largest peers.
Budget for a flexible layer, not a return to FY 2019
Admissions, discharges, and acuity move the care load week to week, and some flexible labor is part of covering that movement; Table 4 shows that spending on it did not return to pre-2020 levels in either setting. A planned flexible layer, built on nurse float pool management and sized to the expected patient census, is easier to budget than unplanned agency use at the point of need, whether that layer is internal staff or per diem clinicians working as independent contractors.
The size of the swing matters as much as where it landed. Hospital contract labor share nearly tripled between FY 2019 and FY 2022, then fell by almost half in two years. A budget built on any single year in that stretch would have missed badly within 24 months. Facilities that treat demand variability as a planning input, and size a flexible layer to it, carry less exposure when the next swing comes.
Check the cost of a schedule before it is published
Scheduling decisions set overtime and contract labor before the month starts, so the schedule is the earliest point at which labor cost can be managed. Before a schedule is published, check what each open shift will cost under every way of filling it: internal staff, overtime or agency. For SNFs, the CMS facility assessment, which is still required after the December 2025 repeal of the minimum staffing rules, must already account for contract staff.
With that said, be sure not to ignore the schedule's pattern. Heavy overtime and long runs of consecutive shifts drive nurse turnover, and each RN who leaves costs an average of $60,090. Workforce management tools such as Central Staffing by Nursa show the labor cost of staffing options before a schedule goes live.
What is Central Staffing?
Nursa is a workforce management platform designed for nursing directors, administrators, and schedulers seeking greater control over staffing and labor costs. Central Staffing by Nursa is a scheduling and staff management platform that generates compliant schedules in seconds, accounting for credentials, costs, preferences, and availability.
Leaders who want more time to focus on improving care and less time managing spreadsheets can benefit from Central Staffing, which brings scheduling into one place and helps facilities compare labor costs across different staffing options.
What the healthcare labor cost statistics show
Contract labor's share of labor expense fell from its FY 2022 peak in both hospitals and SNFs, but spending in FY 2024 remained well above FY 2019 in both settings. SNFs carry a structurally higher contract labor share than hospitals, about 3.8 times higher as a share of operating expense in FY 2024. State and ownership differences are large enough that national healthcare labor cost statistics are a starting point for benchmarking, not the benchmark itself.
For a view of how finance and nursing leaders are responding to these costs, see Nursa’s survey of labor opinions among healthcare executives, which asked CFOs and other executives how they are using contract and 1099 clinicians.
Sources:
- Hospital Provider Cost Report Data, FY 2019 through FY 2024 Centers for Medicare & Medicaid Services
- Skilled Nursing Facility Cost Report Data, FY 2019 through FY 2024 Centers for Medicare & Medicaid Services
- Cost Reports by Fiscal Year, Centers for Medicare & Medicaid Services
- Costs of Caring: Challenges Facing America's Hospitals as They Care for Patients in 2026, American Hospital Association
- March 2026 Report to Congress: Medicare Payment Policy, Medicare Payment Advisory Commission
- National Hospital Flash Report, March 2026 Metrics, Kaufman Hall
- Consumer Price Index: 2024 in review : The Economics Daily

